Unlike many of the market's recent rally attempts, stocks actually held on to their gains from Tuesday's monstrous buying spree and even managed to close a bit higher. After consolidating throughout the day in a sideways range, the S&P 500 finished 0.2% higher and the Dow Jones Industrials eked out a 0.1% gain. A continued recovery in the biotechs and more gains in the semiconductors helped the Nasdaq to tack on another 0.6% advance. Leading the market again were the small-cap Russell 2000 and S&P Midcap 400 indices, which gained 1.1% and 1.0% respectively. In yesterday's Wagner Daily, we mentioned that the small and mid-cap sectors were the lowest risk areas to be long because both indices closed at new record highs on Tuesday and therefore had no resistance to deal with. The fact that these indices again led the market is a good example of how indexes, stocks, and ETFs that are trading at new highs can easily continue higher, even without much buying pressure, simply due to the lack of sellers who bought at higher prices. This is why we often target breakouts to new 52-week highs as potential long positions, especially when the breakout was from a long base of price consolidation.
Total volume in the NYSE declined by 7% yesterday, while volume in the Nasdaq was 3% lower than the previous day's level. While it would have been more positive to see the broad market gain on higher volume, a small decline in turnover was not surprising considering the previous day's volume surge. Further, volume in both exchanges still managed to exceed average levels, an uncommon occurrence in recent weeks. Market internals were solid, though certainly not as impressive as the previous day. Advancing volume exceeded declining volume by a margin of 1.7 to 1 in the NYSE and 2 to 1 in the Nasdaq.
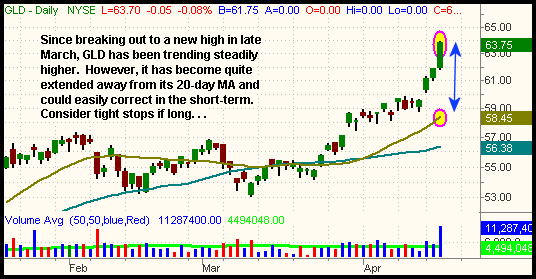
Taking a look at the industry sector action, the only sector that showed a substantial loss was Home Construction ($DJUSHB), which fell 1.8%. Note, however, that the index gained 4.3% the previous day. Led by weakness in IBM, computer hardware stocks also showed weakness, but the semiconductors did not. The Philadelphia Semiconductor Index ($SOX) added on another 1.8% gain to Tuesday's 3.4% advance. Even better than the performance of the $SOX yesterday was the continuation of monstrous relative strength in both the gold and oil service sectors. The Gold Index ($GOX) zoomed 3.7% higher, while the Oil Service Index ($OSX) cruised to a 2.6% gain. It was the third consecutive day that the $GOX closed at a new record high. The $OSX broke out above its prior high from January 30 and also closed at a fresh all-time high. A new 25-year high in the price of spot gold and another record high in the crude oil futures coincided with those gains. If you've been paying attention to our sector commentary and have been long the StreetTRACKS Gold Trust (GLD) for the past week, you are undoubtedly pleased. However, you may now wish to consider a tighter stop because GLD is becoming quite extended to the upside and could easily correct without warning. Looking at the daily chart below, notice how far away from its 20-day moving average GLD has become. The 20-day moving average acts like a bungee cord that yanks the price of a stock or ETF back whenever it stretches too far away in either direction:

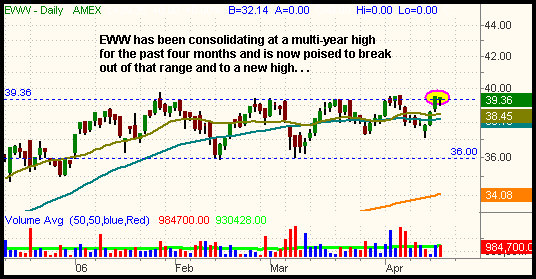
While scanning for interesting and fresh ETF setups this week, we came across an unusual ETF that many traders do not follow, but is showing a great chart pattern nevertheless. The mystery ETF in question is the iShares Mexico Index (EWW), which is comprised of publicly traded securities in the Mexican stock market. International ETFs in general have been very hot over the past year, but the problem is that many of them are already too far extended from their breakout levels in order to be considered for long entry. EWW, however, has been consolidating in a sideways range for nearly four months and is now poised to finally break out to a new high. The horizontal lines on the chart below mark the upper and lower channels of this range:

Obviously, nobody knows for certain when, or even if, EWW will resume its multi-year uptrend by breaking out to a new high, but you may wish to set a price alert on your trading software so that you are instantly notified when it finally takes off. The closing high of the range is 39.45, only nine cents above yesterday's close. The intraday high of the range is 39.73. Regular subscribers will see the trigger, stop, and target prices for this setup on "Today's Watchlist" below.
As for the broad market, we still would like to see the S&P and Nasdaq prove they can break out to new highs and hold the breakouts before getting too aggressive on the long side of the market. We will probably see at least a test of those highs very soon (check yesterday's newsletter for annotated charts of those highs). Conversely, broad-based shorts remain a bad bet unless the market gives back all of Tuesday's gains within the next few days. Overall, it's okay to have one hand on the buy button right now, particularly in the sectors showing relative strength, but just keep your other hand free to hit the emergency brakes just in case. The fact that a plethora of companies are reporting earnings within the next week is further reason for caution.
Deron Wagner is the Founder and Head Trader of both Morpheus Capital LP, a U.S. hedge fund, and Morpheus Trading Group, a trader education firm launched in 2001 that provides daily technical analysis of the leading ETFs and stocks. For a free trial to the full version of The Wagner Daily or to learn about Wagner's other services, visit MorpheusTrading.com or send an e-mail to deron@morpheustrading.com.