Stocks concluded the holiday-shortened week with a session of modest gains last Thursday, as small caps and tech stocks helped the Nasdaq to show relative strength. The broad market showed weakness in the morning, but the S&P 500 bounced after finding support at its prior low from April 11. Although the index attempted to put in a short-term double bottom, the S&P 500 managed only a 0.1% gain, as did both the Dow Jones Industrial Average and S&P Midcap 400 indices. Thanks to a 1% recovery in the beaten-down Biotech Index ($BTK), the Nasdaq fared better with a 0.5% gain. The small-cap Russell 2000 rallied 0.5% as well. Despite the small gains of the last two days, both the S&P and Nasdaq still finished the week lower by 0.5% and 0.6% respectively. The Dow, however, managed a 0.2% gain.
As anticipated, turnover again declined in last Thursday's pre-holiday session. Minimal participation from institutions caused volume in the NYSE to decline by 10%, while volume in the Nasdaq was about the same as the prior day's level. Volume in the NYSE was so light that it fell below the April 10 level, which had just registered as the lightest volume day of the calendar year. Of the past nineteen sessions, turnover in the NYSE has exceeded its 50-day average level only one time! Although the popular financial media may not be discussing this peculiarity, we feel it is very important to note. An extended period of such light turnover tells us that, for one reason or another, institutions have completely backed away from taking a stand on either side of the markets. This matters because institutional trading activity typically accounts for more than 60% of the stock market's average daily volume. As such, the direction that institutional traders dec! ide to take leading stocks is usually the direction the entire broad market follows. But when there are is no clear indication of institutional activity, caution is definitely in order because stocks can make a swift move in either direction when the mutual and hedge funds eventually return to the markets aggressively. We were expecting the advent of quarterly earnings season to generate higher volume levels, but that has not happened so far.
For the past two days, the 50-day moving average has acted like a magnet on the S&P 500. When the index closed below support of its six-month uptrend line on April 11, we mentioned this was a negative sign for stocks, but also cautioned against aggressively starting to sell stocks short due to support of the S&P's 50-day moving average. But while the closely-watched indicator has indeed halted the recent decline in the index, the S&P has also failed to muster up enough momentum to significantly bounce off the 50-day MA. Instead, the S&P closed the past three days virtually right on that moving average:
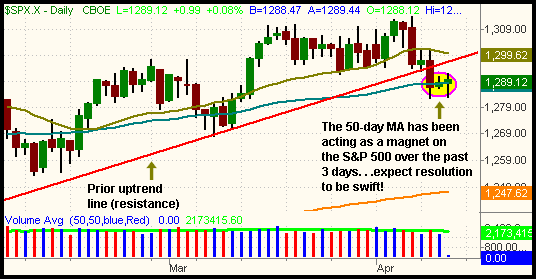
The good news is that we feel the index will make a substantial move away from its 50-MA within the next day or two. If it attempts to rally, be aware of new resistance at its prior six-month uptrend line. Presently, that uptrend line is coming in just below the 20-day moving average, just below the 1,300 level. Additionally, a lot of overhead supply remains from traders who bought the month-long consolidation in the S&P in anticipation of new highs. Certainly, we can expect to see those people selling into strength on any bounce because human psychology of the average retail investor is that he only "hopes to break even" after a stock or ETF has moved against him.
Conversely, short-term support for the S&P 500 is now defined around the 1,283 area. This is the level where the S&P found support last Friday morning and reversed, so it could easily do the same again. The three-day chart of the S&P below illustrates how the index has attempted to form a short-term double bottom at the 1,283 level:
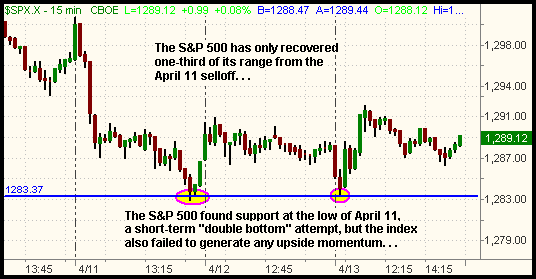
If stocks head lower and the 1,283 level is broken, we will probably see a rapid drop down to the March lows in the 1,268 to 1,272 range. If downside momentum accelerates quickly enough, it would not be unreasonable to foresee a sharp selloff down to the February lows, which is just above the 200-day moving average. But for now, the S&P 500 is simply glued to its 50-day moving average. We share these support and resistance levels with you only so that you may be prepared in the event of a swift move in either direction within the next day or two. Our overall bias remains cautiously bearish, but we are prepared to cover our short positions at a moment's notice because we do not yet have enough confirmation that the recent weakness will see further follow-through. Regardless, we feel that recent action has been negative enough to "test the waters" on the short side of those sectors and indices that have been showing the most relative weakness.
Although both sectors finished last week on a bounce, the Biotech and Semiconductor sectors remain among the weakest sectors right now, as do the Pharmaceuticals and Utilities. On the long side, the only sectors we would consider are: gold and metals mining, and oil/oil service. For broad-based ETFs, the S&P 500 Index (SPY) is probably the clearest short setup due to its break of the daily uptrend line.
Deron Wagner is the Founder and Head Trader of both Morpheus Capital LP, a U.S. hedge fund, and Morpheus Trading Group, a trader education firm launched in 2001 that provides daily technical analysis of the leading ETFs and stocks. For a free trial to the full version of The Wagner Daily or to learn about Wagner's other services, visit MorpheusTrading.com or send an e-mail to deron@morpheustrading.com.


 Free Festival of Traders Videos