The major indices spent yesterday's session consolidating near the prior day's lows before finishing the lethargic day near unchanged levels. The Nasdaq Composite made a feeble rally attempt at mid-day, but traders quickly sold into strength and caused the index to slide into negative territory. The Nasdaq recovered off its intraday low, but still lost 0.3%. The S&P 500 followed a similar intraday pattern, but managed to hold on to a 0.1% closing gain. Relative strength in the large cap stocks helped the Dow Jones to advance 0.2%, but small and mid-caps showed the most weakness. Both the Russell 2000 and S&P Midcap 400 indices fell 0.4%.
Curiously, turnover in the NYSE dried up to its lowest level of the year yesterday. Total volume in the NYSE declined by 12%, while volume in the Nasdaq was 6% lighter than the previous day's level. The 1.36 billion shares traded in the NYSE was the lowest volume day since December 29, a day that obviously sees light annual activity because it falls between the Christmas and New Year's Day holidays. Volume in the Nasdaq was also well below average, but was not the lightest of the year. To the dismay of momentum traders, volume in the NYSE has only exceeded its 50-day average level one time within the past sixteen sessions! Clearly, that helps to explain the broad market's choppy and erratic behavior that typically results from a lack of institutional participation. The good news is that the commencement of quarterly earnings season will probably bring trading activity back to life.
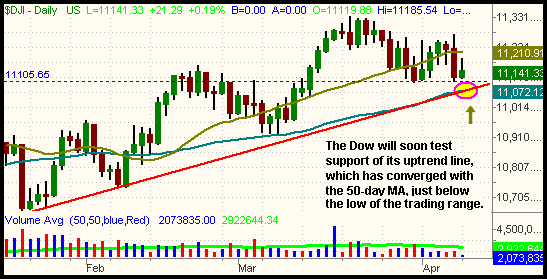
In yesterday's Wagner Daily, we pointed out how the S&P finished last week just above support of its multi-week trading range and its six-month daily uptrend line. Because the index traded in a relatively narrow range and closed near the flat line yesterday, the technical picture for the S&P has not changed. With the uptrend line rising up from above, the S&P will be forced to make a decision here. Either the uptrend remains intact and the S&P rallies back to the top of its range, or it breaks support of the uptrend. If the latter occurs, it would also correspond to a break below the low of the multi-week sideways range at the 1,291 area. In our eyes, either scenario would be equally welcome because a volume surge and a new trend in either direction will likely result, and that sure as heck beats the recent chop. To make matters even more interesting, notice that the Dow has also come into support of its uptrend line and is sitting right at the lows of its recent trading range:

The daily chart of the Dow is similar to the S&P 500 in that both indices are coming into support of their uptrend lines and are sitting near the bottom of their multi-week trading ranges. However, one distinct difference between the two charts is that the Dow has been showing more relative weakness. When the S&P rallied (albeit briefly) to a new 5-year high last week, the Dow barely budged. Therefore, this relative weakness leads us to believe that any downward momentum would be led more so by the Dow than the S&P.
Trading the broad-based ETFs such as SPY (S&P 500) or DIA (Dow Jones Industrials) would have been very challenging during the past month. However, a clear break of this convergence of support in either the S&P or Dow may present a good risk/reward ratio for selling short SPY or DIA. Just be sure to wait for an actual break to happen; don't jump the gun in anticipation. As for the other broad-based ETFs such as MDY, QQQQ, or IWM, the patterns are not as clear.
Aluminum giant Alcoa (AA) kicked off corporate earnings season with the announcement of its quarterly report after the close of trading yesterday. They beat analysts' estimates and the stock received an initially positive response in the after-hours market. Pay close attention to how the S&P and Dow react to that news today because that will tell us a lot about the current sentiment of the markets. Weak markets tend to ignore good news, just as strong markets tend to blow off bad news. Biotech behemoth Genentech reports after today's close, so be aware of that if you are still short the Biotech HOLDR (BBH) or any other biotech stocks.
In miscellaneous ETF news, yesterday saw the launch of a brand new ETF that mirrors the price of the Crude Oil commodity. It is called the U.S. Oil Fund and it trades under the ticker "USO." Like the Gold Trust ETF (GLD), the Crude Oil ETF is pegged to the price of the underlying commodity. One share of USO is approximately equal to the price of a barrel of crude oil (less a small expense fee that is built in to the ETF). So far, there are a total of three primary ETFs that allow investors and traders to easily speculate on the price of commodities with the same simplicity and minimal costs as trading a stock. They are: Gold (GLD), Crude Oil (USO), and the Deutsche Bank Commodity Index (DBC). An ETF that tracks the price of silver, SLV, is expected to be launched later this year.
Deron Wagner is the Founder and Head Trader of both Morpheus Capital LP, a U.S. hedge fund, and Morpheus Trading Group, a trader education firm launched in 2001 that provides daily technical analysis of the leading ETFs and stocks. For a free trial to the full version of The Wagner Daily or to learn about Wagner's other services, visit MorpheusTrading.com or send an e-mail to deron@morpheustrading.com.