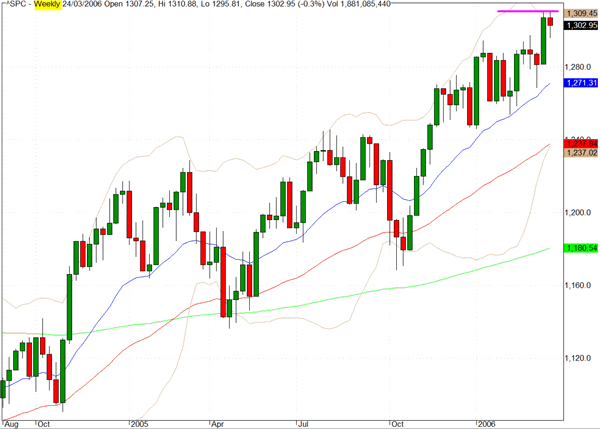
Stepping back from the daily chart action we shall focus on the weekly charts for the key indices. The chart for the S&P 500 reveals a very narrow range to last week's trading. Only 15 points separated the low for the week and the high for the week which, at 1310.88, was fractionally higher than the previous week's high.
The S&P Midcap index closed the week at 786 which was an all time high and the small cap Russell 2000 index also finished the week on a further all time high of 753. This index has gained almost 12% since the beginning of 2006 while the S&P 500 is up slightly less than 10%
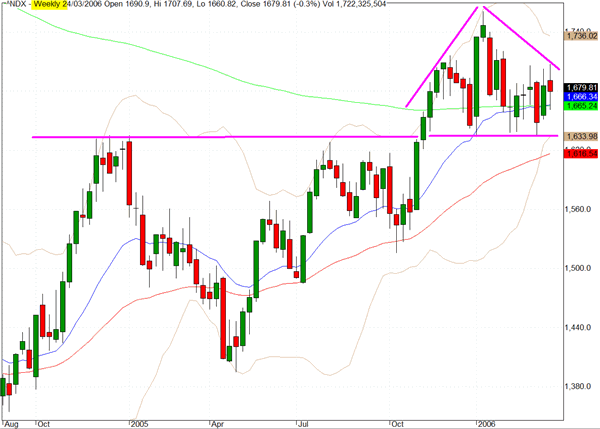
The weekly chart for the Nasdaq 100 index (^NDX) continues to show the most interesting chart formation of the major indices. We have marked the breakout level around 1635 from last October when the index began a thrust upwards that also took it through its 200 week exponential moving average.
This was the last of the major indices to break above its 200 week EMA barrier and, as the chart reveals, it then moved quite sharply up to its early Janaury peak above 1760. Since then the index has notably underperformed and been immersed within a congestion pattern just above the 200 week EMA where we suspect there has been continuing absorbtion of supply which dates back to the bubble years.
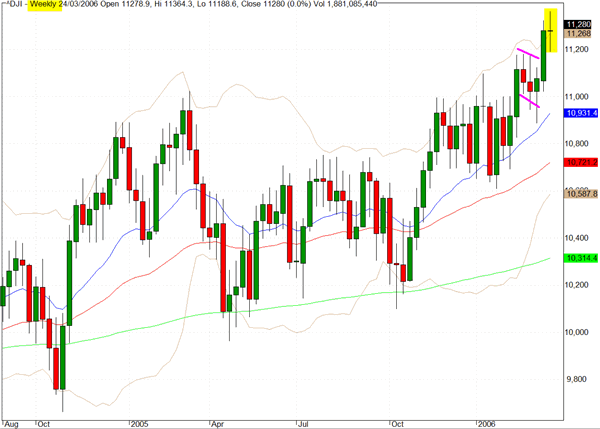
The Dow Jones Industrials (^DJI) finished last week almost exactly where it closed the previous week and in so doing created a Doji formation with long tails on either side. The previous week√Ę‚,¨‚"Ęs long green candle now reveals itself as a signficantly bullish move for this index, following on from the mini bullish flag that developed in the preceding three weeks.
With an FOMC meeting this coming week and with the recent volatile action in the Treasury market it is not surprising that there is some directional uncertainty at this juncture. At the end of last week bond traders appear to have scaled back their expectations of further tightening in the wake of some weakness in the housing sector and benign inflation indicators. If, however, the FOMC announcement points toward ongoing rate hikes we could well see another spike in yields that may unsettle the stock market
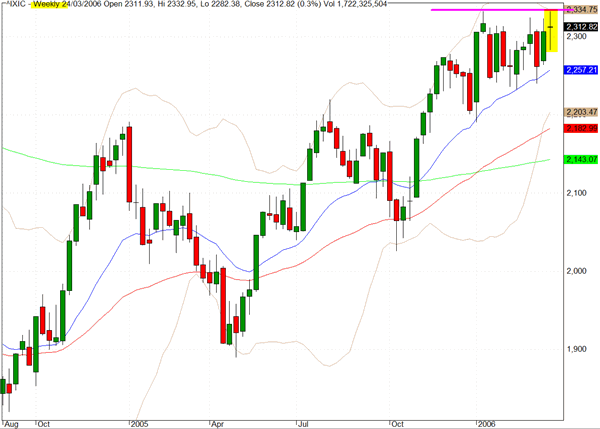
The Nasdaq Composite index (^IXIC) stalled last week at exactly the level of the previous highs from early January and closed the week again with another Doji formation.
TRADE OPPORTUNITIES/SETUPS FOR MONDAY MARCH 27, 2006
The patterns identified below should be considered as indicative of eventual price direction in forthcoming trading sessions. None of these setups should be seen as specifically opportune for the current trading session.
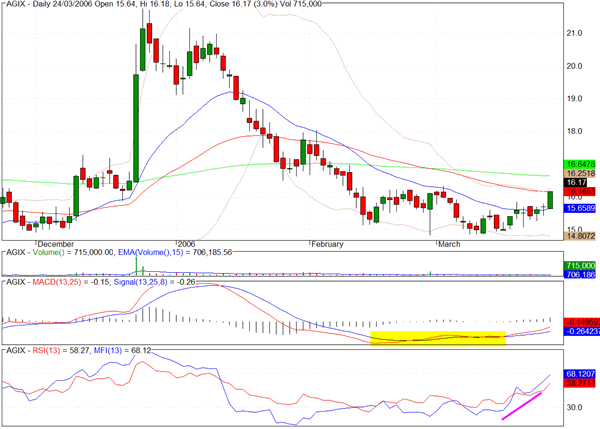
AtheroGenics (AGIX) has shown striking weakness since its major upward move in late December and has been building a saucer bottom with some evidence of new accumulation.
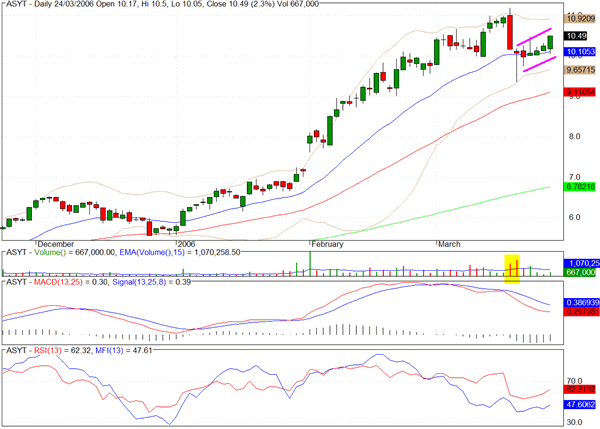
ASYT looks vulnerable and could be headed down to its 50 day EMA.
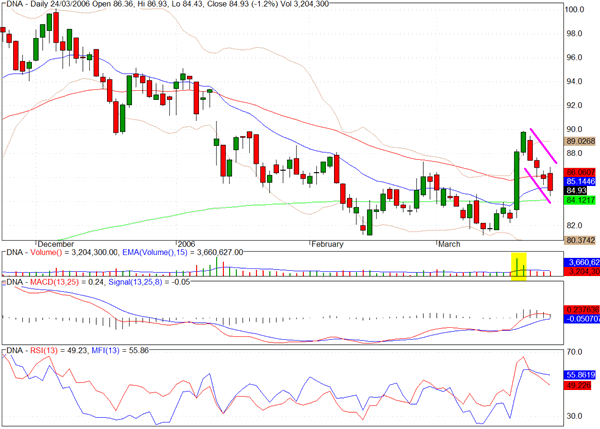
Genentech (DNA) has a bullish channel formation following the long green candle from two weeks ago and we would not be surprised to see further buying interest.
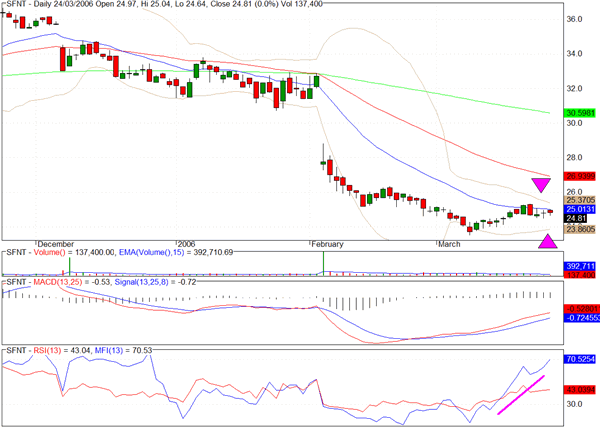
Safenet (SFNT) seems poised for a breakout and the money flow has been very positive
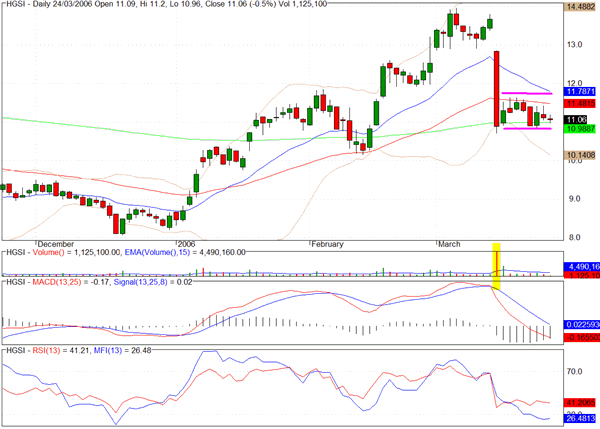
Human Genome Science (HGSI) has entered a horizontal channel formation just above its 200 day EMA and following March 14th's long red candlestick on heavy volume the stock has failed to make any meaningful recovery.
Clive Corcoran is the publisher of TradeWithForm.com, which provides daily analysis and commentary on the US stock market. He specializes in market neutral investing and and is currently working on a book about the benefits of trading with long/short strategies, which is scheduled for publication later this year.
Disclaimer
The purpose of this article is to offer you the chance to review the trading methodology, risk reduction strategies and portfolio construction techniques described at tradewithform.com. There is no guarantee that the trading strategies advocated will be profitable. Moreover, there is a risk that following these strategies will lead to loss of capital. Past results are no guarante of future results. Trading stocks and CFD's can yield large rewards, but also has large potential risks. Trading with leverage can be especially risky. You should be fully aware of the risks of trading in the capital markets. You are strongly advised not to trade with capital you cannot afford to lose. This article is neither a solicitation nor an offer to buy or sell securities.