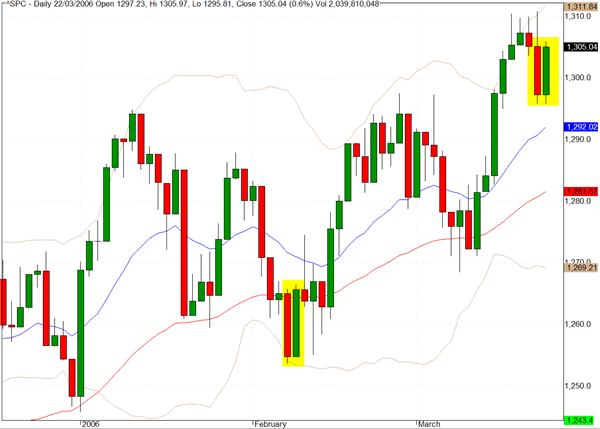
Over the last two sessions, we have seen back to back reversals on the charts of many indices and individual stocks. Looking at the S&P 500 chart the adjacent red/green candlesticks from Tuesday/Wednesday show how more than ten points were covered intraday on both days, with a lot of stops being hit on both sides of the market, but with zero net effect in the closing price. We closed yesterday at 1305 which was exactly where we closed on Monday.
Reviewing the chart we can see a very similar pattern from early February when the index was at the bottom of its range, this time we are at the top of the range. If we were to apply symmetrical logic to this pattern we might be setting up for further weakness, but this is not the message that we are seeing from the overall market's volume and breadth characteristics.
The Dow Jones Transportation Index recorded another all time closing high yesterday of 4614.
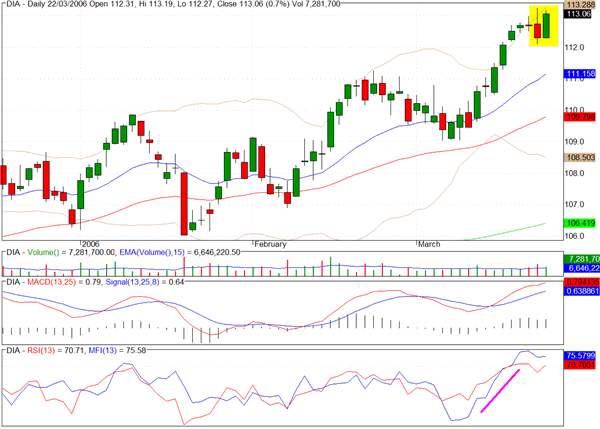
The Dow Jones Industrials reversed Tuesday's decline and closed at 11,317 which was a new multi-year high. Interestingly, while yesterday's wide body green candlestick rather overshadowed the previous day's sell-off, the formation actually reveals an inside day as all of the trading took place within the wider range of Tuesday's action.
Also evident from reviewing the chart for the exchange traded proxy, DIA, yesterday's upward move was on less volume than Tuesday's.
While the Dow Industrials and Transportation indices continue to make progress the same cannot be said for the Dow Jones Utilities index which peaked in January and has since descended in a rather bearish looking pattern. The increase in bond yields is a major factor here but the index may have found near term support as it bounced off its 200 day EMA yesterday.

The chart for the banking sector (^BKX) also reveals a strong reversal from Tuesday's negative session and in reviewing some of the index constituents we see some charts that could be ready to propel this index to new highs. The charts for Citigroup (C), Wells Fargo (WFC) and Bank of America (BAC) look positive with Citigroup showing the clearest evidence of buying pressure.

TRADE OPPORTUNITIES/SETUPS FOR THURSDAY MARCH 23, 2006
The patterns identified below should be considered as indicative of eventual price direction in forthcoming trading sessions. None of these setups should be seen as specifically opportune for the current trading session.
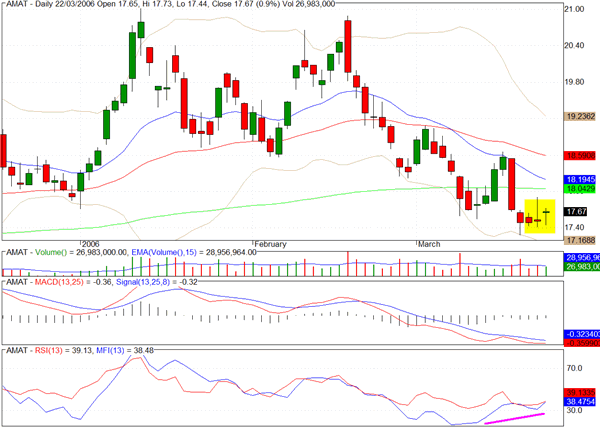
Applied Materials could be preparing to rally.
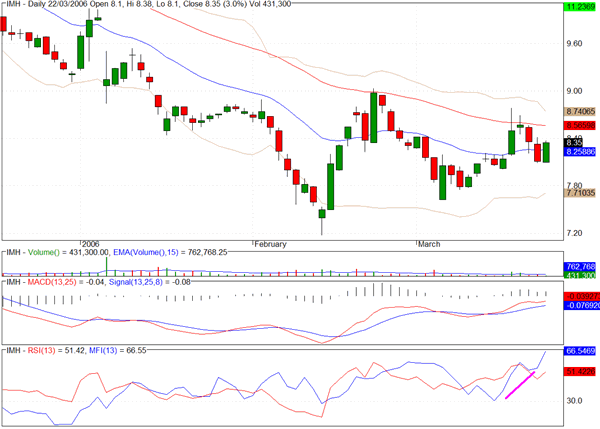
IMPAC Mortgage (IMH) has strong money flow and a bull flag formation.
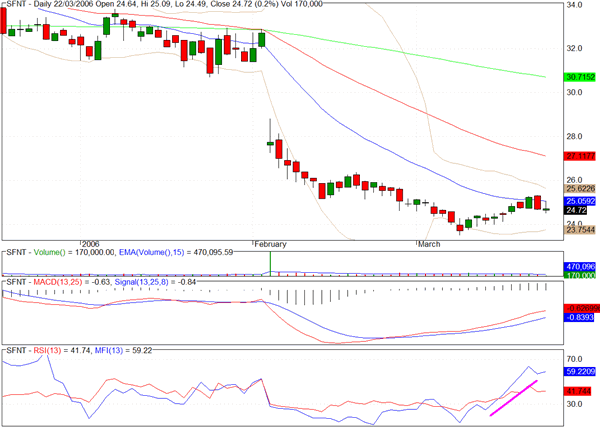
Safenet (SFNT) could be ready to emerge from an extended basing pattern with signs of accumulation.
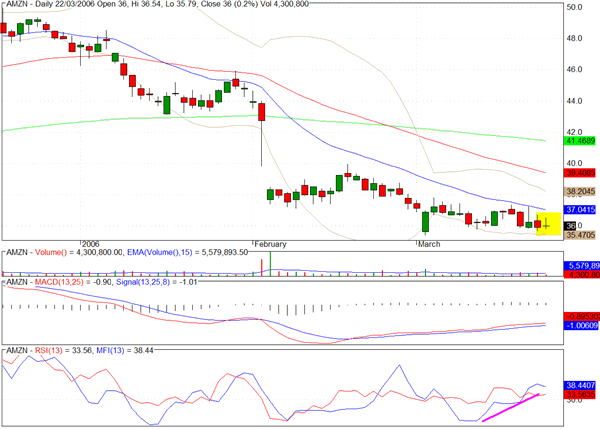
Amazon (AMZN) has been out of favor since disappointing news that triggered the gap down in early February but there is evidence of accumulation and yesterday's Doji/Spinning Top could be a precursor to a rally effort.
King Pharmaceuticals (KG) has one of the more interesting chart formations we have seen and a return to the 50 day EMA seems likely.

Disclaimer
The purpose of this article is to offer you the chance to review the trading methodology, risk reduction strategies and portfolio construction techniques described at tradewithform.com. There is no guarantee that the trading strategies advocated will be profitable. Moreover, there is a risk that following these strategies will lead to loss of capital. Past results are no guarante of future results. Trading stocks and CFD's can yield large rewards, but also has large potential risks. Trading with leverage can be especially risky. You should be fully aware of the risks of trading in the capital markets. You are strongly advised not to trade with capital you cannot afford to lose. This article is neither a solicitation nor an offer to buy or sell securities.
Clive Corcoran is the publisher of TradeWithForm.com, which provides daily analysis and commentary on the US stock market. He specializes in market neutral investing and and is currently working on a book about the benefits of trading with long/short strategies, which is scheduled for publication later this year.