The long green candlestick from last week on the S&P 500 chart below highlights the positive tone to all of last week's trading. The index closed the week at 1307 with a gain of 2% for the week. The close has brought us to the top of the 50 week volatility band and also to a point that coincides with a trendline through the highs extending back to late 2004.
We continue to see broad strength in the market with the smaller cap stocks continuing to outperform. The Russell 2000 closed on Friday at another all time high and the S&P Midcap index came within less than a point of its all time high recorded on March 1st.
While performing some research over the weekend for a forthcoming book one of the big themes that intrigues us about the recent market environment is the significantly reduced volatility observable in most of the indices since 2003 when the markets began their recovery. One of the few indices to reveal greater volatility since 2003 is the Russell 2000 but investors have been well rewarded for assuming the greater day to day volatility as the index has risen by more than 100% since April 2003.

The Dow Jones Industrials also performed well last week with a 1.8% gain to close at 11,279. The index has reached above its 50 week volatility band and there is previous chart resistance in the 11,300 region but it seems that the index has its sights set on the previous all time high of 11,722.98 (intra-day high 11,908.50) on January 14, 2000.
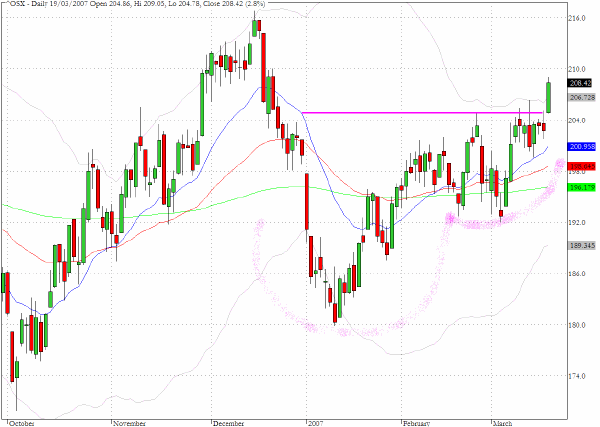
One of the standout performances last week was recorded by the retail sector. The S&P Retail index (^RLX) gained 3.4% on the week and is now back to levels not seen since last July. The index was one of the prime beneficiaries from last week√Ę‚,¨‚"Ęs pronounced decline in Treasury yields. As we noted last week the yield on the Ten Year note touched 4.8% in trading last Monday but declined by 13 basis points to finish the week at 4.67%.

TRADE OPPORTUNITIES/SETUPS FOR MONDAY MARCH 20, 2006
The patterns identified below should be considered as indicative of eventual price direction in forthcoming trading sessions. None of these setups should be seen as specifically opportune for the current trading session.
Louisiana Pacific (LPX) has recovered from its steep sell-off earlier in March on subdued volume. It has reached a point where the 20 and 50 day EMA's are converging and could be vulnerable to further weakness.
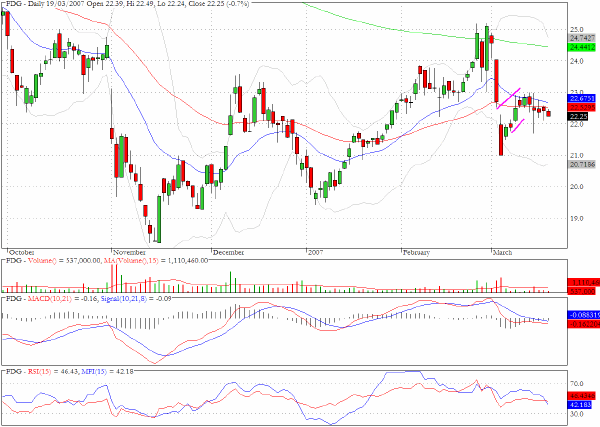
Altera (ALTR) registered a hammer candlestick on Friday with a long lower tail that pierced below the 200 period EMA but enabled it to close just above both the 200 and 50 day EMA. Volume was above average and the stock may have found some buying interest to echo the gap up on March 1st.

HGSI could continue further downwards but the setup may be for later this week.
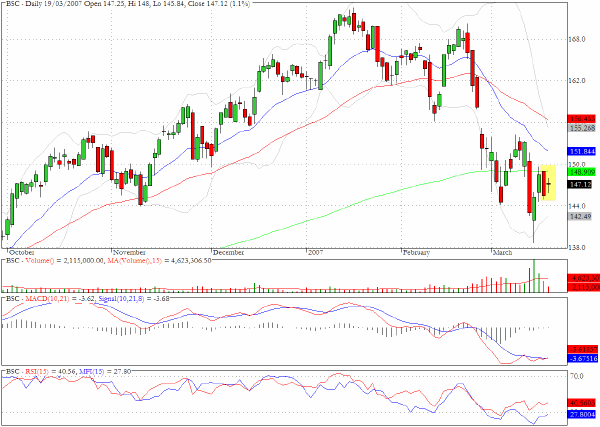
Hewlett Packard (HPQ) looks attractive as a possible breakout with rapidly accelerating money flow.
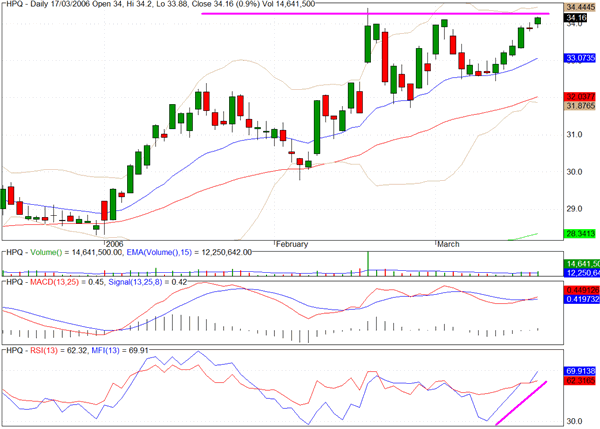
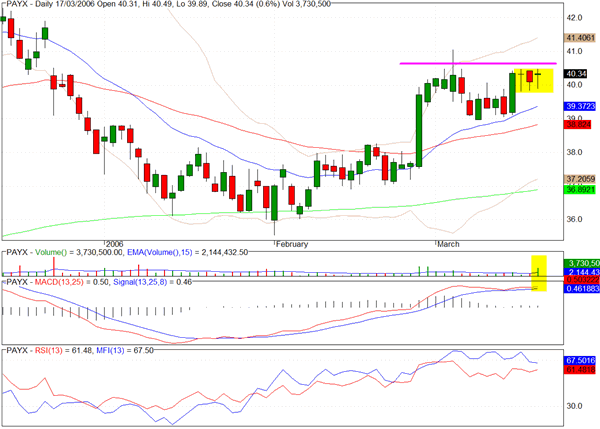
Paychex (PAYX) has a basing pattern just below its recent highs and there is a mini bull flag formation.
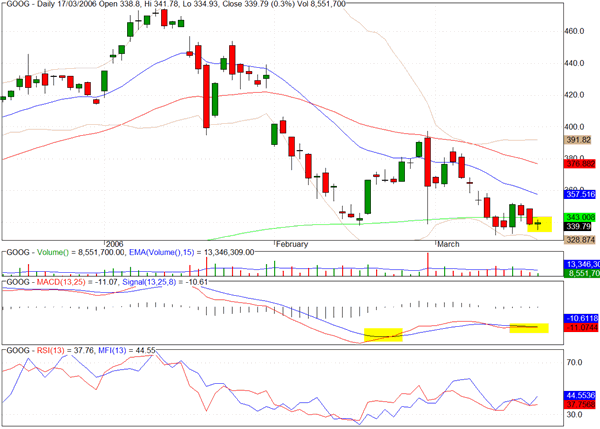
Google (GOOG) is flirting with its 200 day EMA and there is some evidence of positive divergences.
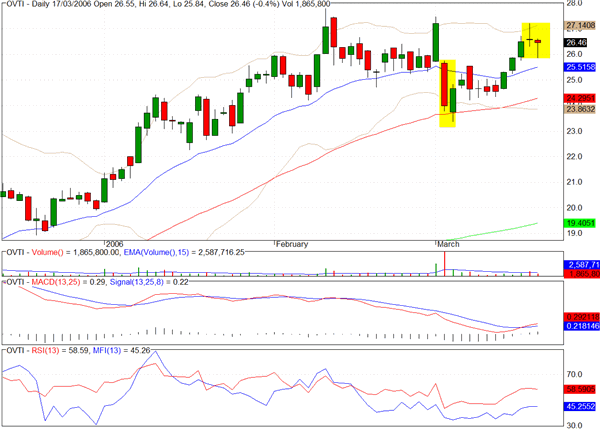
Omnivision Technologies (OVTI) would appear to offer a fairly attractive reward/risk proposition on the short side.
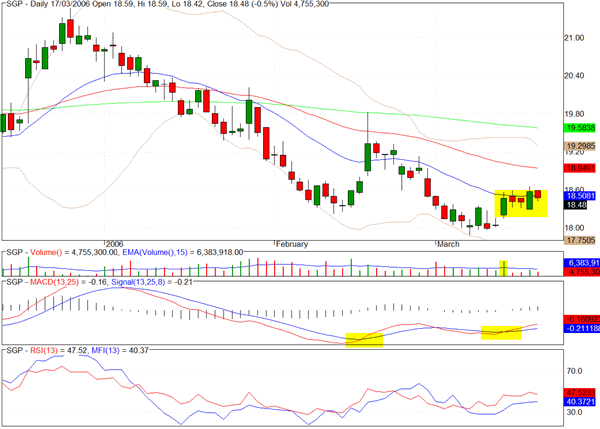
Schering Plough (SGP) may have complete a double bottom
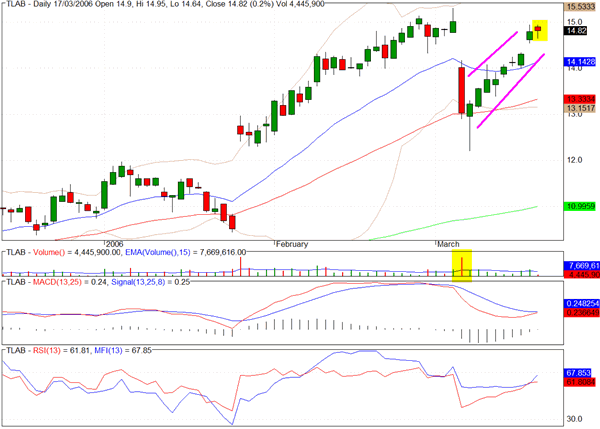
We were stopped out of our short position in Tellabs (TLAB) but it still appears to be defying gravity to our eyes.
Disclaimer
The purpose of this article is to offer you the chance to review the trading methodology, risk reduction strategies and portfolio construction techniques described at tradewithform.com. There is no guarantee that the trading strategies advocated will be profitable. Moreover, there is a risk that following these strategies will lead to loss of capital. Past results are no guarante of future results. Trading stocks and CFD's can yield large rewards, but also has large potential risks. Trading with leverage can be especially risky. You should be fully aware of the risks of trading in the capital markets. You are strongly advised not to trade with capital you cannot afford to lose. This article is neither a solicitation nor an offer to buy or sell securities.
Clive Corcoran is the publisher of TradeWithForm.com, which provides daily analysis and commentary on the US stock market. He specializes in market neutral investing and and is currently working on a book about the benefits of trading with long/short strategies, which is scheduled for publication later this year.