Stocks followed up the previous day's breakout with another session of higher volume gains across the board. After consolidating for most of the day in a narrow range and near the previous day's highs, a wave of buying led the broad market to positive territory in the final two hours. The Nasdaq Composite advanced 0.7%, while the small-cap Russell 2000 Index turned in an equally solid 0.9% gain. The S&P 500 gained 0.4%, the S&P Midcap 400 Index 0.7%, and the Dow Jones Industrials 0.5%. Like the previous session, each of the major indices finished near their intraday highs.
For the second consecutive day, turnover increased on both exchanges. Total volume in the NYSE was 5% higher, while volume in the Nasdaq increased by 9%. This registered a bullish "accumulation day" for both the S&P and Nasdaq. Market internals were firmly positive in both exchanges as well. In the NYSE, advancing volume exceeded declining volume by a ratio of just over 2 to 1. In the Nasdaq, volume breadth was even better at 7 to 2. For the first time in five sessions, volume in the Nasdaq rose above its 50-day average level, but volume in the NYSE was again below average. We find it a very odd divergence that the S&P has closed at new four-year highs in each of the past two days, but volume did not even rise above average levels in the process.
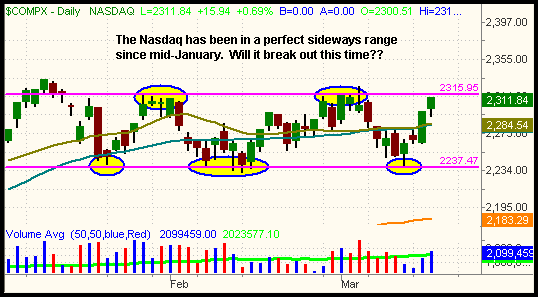
Going into today, we are keeping a close eye on the pivotal 2,315 resistance level in the Nasdaq Composite. This area of horizontal price resistance stopped the Nasdaq's rally attempt on three separate occasions since the beginning of 2006. Being that the Nasdaq closed at 2,311 yesterday, we are likely to see another test of that resistance level today. As the daily chart below illustrates, the Nasdaq has been stuck in a clear sideways range since mid-January:

If the Nasdaq can firmly close above the 2,315 level this week, it could definitely help to confirm the S&P and Dow's breakouts to new highs. But if the Nasdaq remains in its two-month sideways range, it would certainly be a drag on the S&P and Dow. Neither of those indices can rally for long without the Nasdaq following suit.
Unfortunately for the Nasdaq, the heavily weighted Semiconductor Index ($SOX) continues to look pretty bad. The broad market strength of the past two days enabled the $SOX to recover only 25% of its loss from the March 2 high down to the March 13 low. More importantly, the $SOX is still more than 2% below overhead resistance of its 20-day moving average and nearly 3% below its 50-day MA. If the Nasdaq is unable to break out above the 2,315 resistance level and begins to fall back down, expect the $SOX to lead the way lower. Shorting sector ETFs with relative weakness to the broad market is always a strategy that provides a positive risk/reward ratio. As such, you might consider shorting either IGW (iShares Semiconductor) or SMH (Semiconductor HOLDR) into this bounce in the $SOX. If the Nasdaq breaks out above resistance, you can easily cover your position for a small loss, but your short entry point into this bounce is ideal if the Nasdaq remains in the range and the $SOX resumes its relative weakness.
Yesterday's action did little to change our overall short-term bias on the markets. The mixed signals and divergence within the major indices is causing us to maintain our neutral and cautious view of the broad market. While the S&P and Dow are sitting at new highs, the Nasdaq, Russell 2000, and S&P Midcap 400 are all lagging behind. Confusing the picture even more has been the light volume levels during this week's breakout, along with the fact that such a small percentage of stocks followed along to new 52-week highs. While we certainly are not as confident on the short side as we were just a few days ago, we feel it is foolish to blindly buy stocks just because the S&P managed to set a new high. Many astute traders are sitting on the sidelines right now, or at the very least, are positioned on both sides of the market.
Deron Wagner is the Founder and Head Trader of both Morpheus Capital LP, a U.S. hedge fund, and Morpheus Trading Group, a trader education firm launched in 2001 that provides daily technical analysis of the leading ETFs and stocks. For a free trial to the full version of The Wagner Daily or to learn about Wagner's other services, visit MorpheusTrading.com or send an e-mail to deron@morpheustrading.com.