| The Wagner Daily ETF Report For September 8 |
| By Deron Wagner |
Published
09/8/2014
|
Stocks
|
Unrated
|
|
|
|
The Wagner Daily ETF Report For September 8
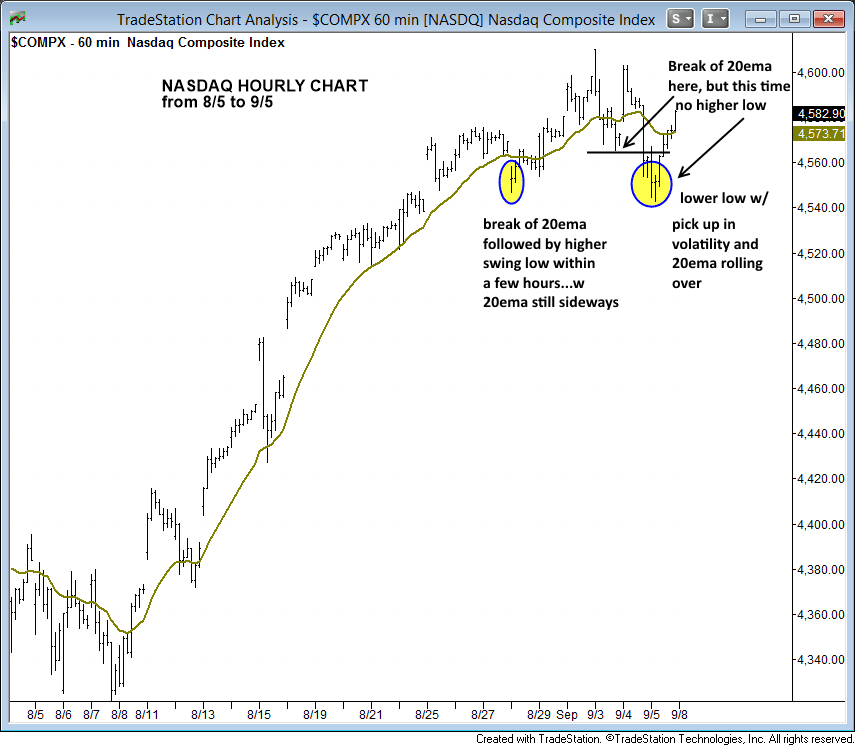
In last Friday's report, we mentioned the potential for the Nasdaq to enter into consolidation mode unless it could reclaim 4,570 and push through the 20ema on the 60-minute chart. Well it did just that on Friday after undercutting the low of 8/28 in what was a volatile opening hour of trading.
By the close, the Nasdaq reclaimed the rising 10-day MA (on daily chart) and 20-period EMA (on the hourly chart). Both averages have converged around the 4,570 level, which could be the line in the sand for the current rally to maintain momentum.
If the Nasdaq can hold this area (give or take a few points on a pullback), then it may be able to push to new swing highs in short order. A break of this level would suggest further consolidation is needed before heading higher.
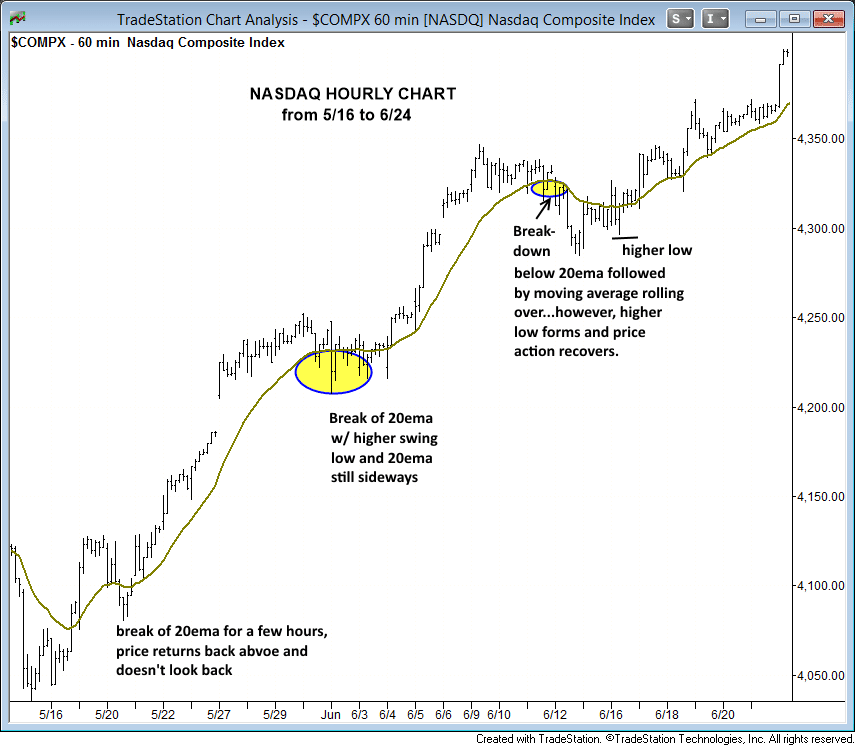
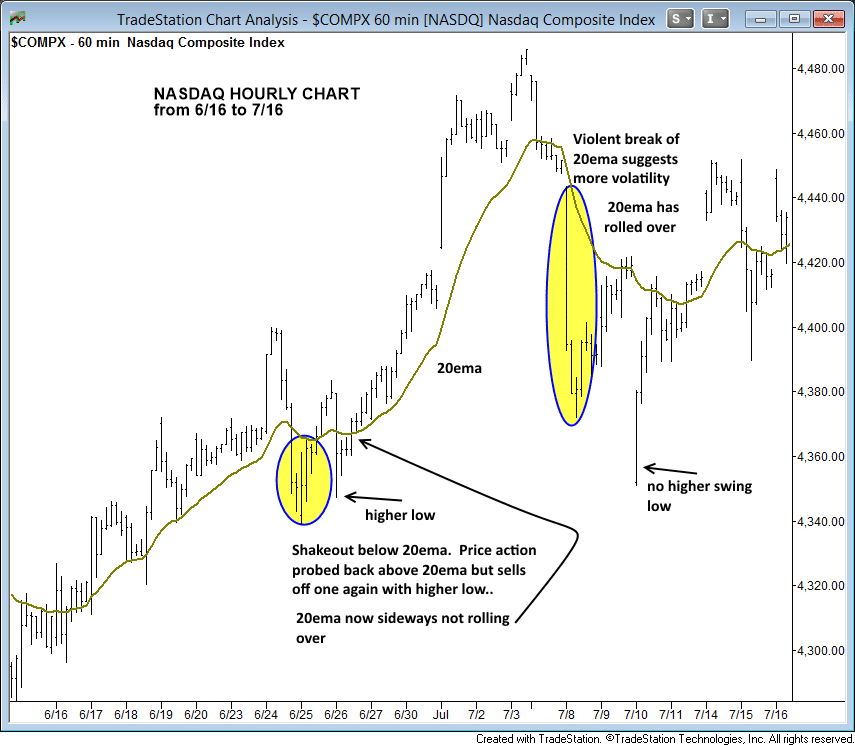
Through the years we have found the 20-period EMA to be a great tool for measuring the strength of the rally, along with the 10-day MA on the daily chart. Simply put, it is tough to question the strength of price action when it's trending higher above a rising 20-period EMA on an hourly chart.
When the price action slips below the 20-period EMA it is a warning signal. If the move was just a minor shakeout, then the price action should reclaim the 20-period EMA within a few hours to a few days, or at the very least set a higher swing low below the 20ema.
Smaller shakeouts will usually recover back above the 20ema within a few hours while the 20ema flattens but avoids rolling over. However, when volatility picks up and there is a severe break of the 20-period EMA (usually by 1% or more on an index), the 2Oema will roll over and the price action can become quite volatile, with multiple crosses above and below the 20ema over a few days.
The next few charts show how the price action reacts to the 20-period EMA on the hourly chart over a few weeks of trading (in an uptrend).
There is one new buy setup on today's watchlist in Super Micro Computer ($SMCI), which has formed a flat base pattern after breaking out from a bullish consolidation earlier in the year.
The recent pullback on light volume to the 50-day MA presents us with a low risk entry point (after a big volume move out). Our stop is beneath the low of the 8/6 shakeout bar, which is the low of the current base.
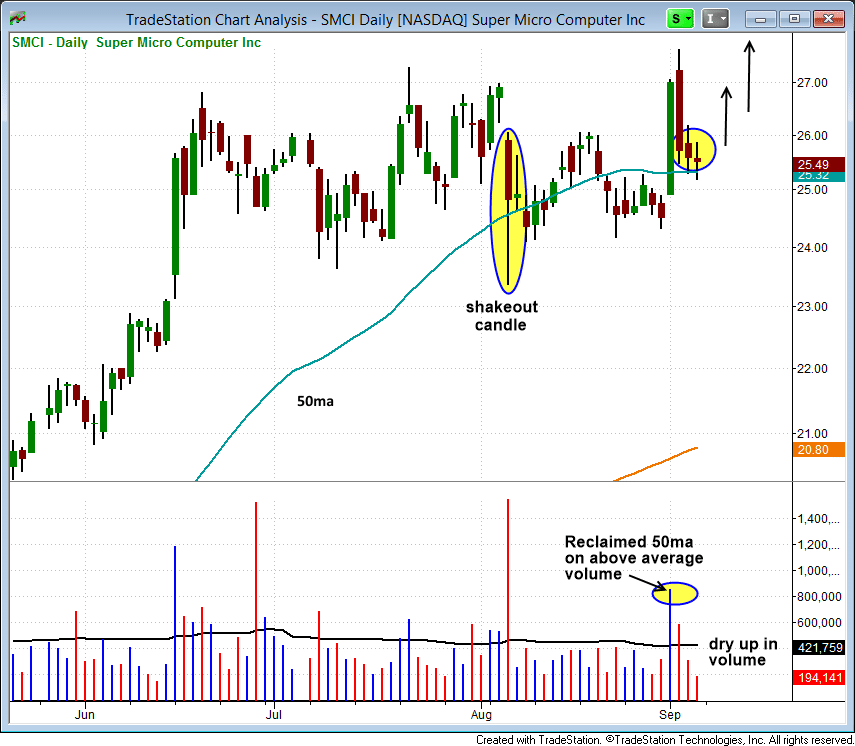
$SMCI broke out to new all-time highs earlier in the year. It has a 96 relative strength ranking and a 91 EPS ranking, with solid earnings and revenue growth the past 5 quarters. This is a swing trade (not a core position). Subscribers of The Wagner Daily should note our exact trigger, stop, and target prices for this setup in today's newsletter.
Deron Wagner is the Founder and Head Trader of both Morpheus Capital LP, a U.S. hedge fund, and MorpheusTrading.com, a trader education firm.
|


 Free Festival of Traders Videos