| The Wagner Daily ETF Report For July 17 |
| By Deron Wagner |
Published
07/17/2014
|
Stocks
|
Unrated
|
|
|
|
The Wagner Daily ETF Report For July 17
The Nasdaq Composite has stalled all week at the 4,450 level. Total volume was 18% higher on the Nasdaq, and much of that volume can be attributed to the monster volume in Intel ($INTC), but not all. So, for the second day in a row there was some selling into strength at the 4,450 level.
The Nasdaq uptrend remains in good shape, but the recent stalling action suggests that there could be a few weeks of chop while the 50-day MA catches up.
As for ETFs, we continue to lay low with regard to new positions, as we patiently wait for new setups to emerge.
In yesterday's report we mentioned energy ETF ($XOP) as a potential pullback candidate depending on how the price action closed out the week. Another ETF on our internal watchlist is Nikkei 225 ETF ($NKY), which has formed a cup with handle pattern on the weekly chart below.
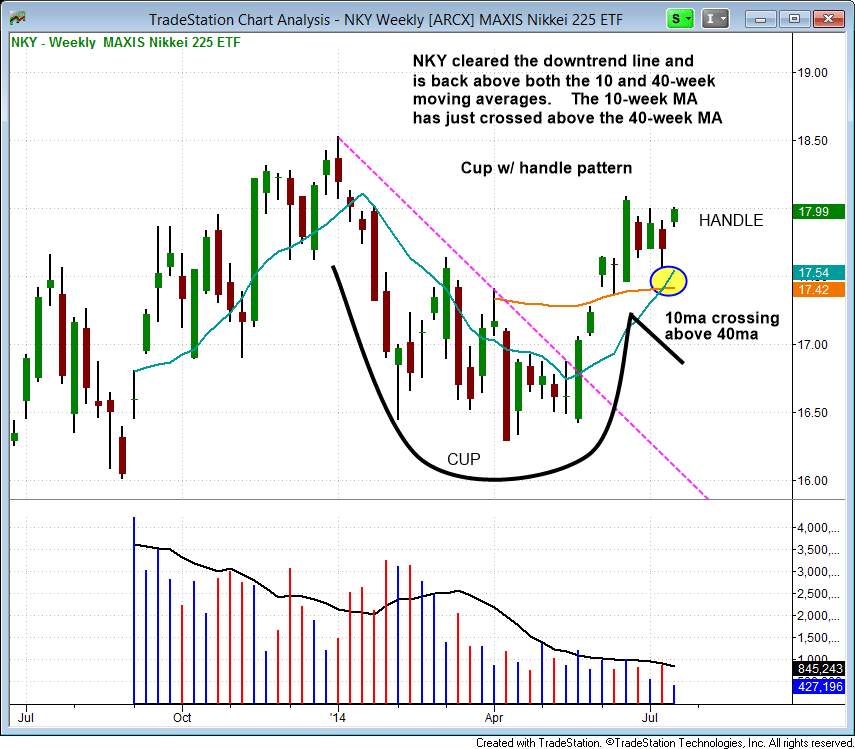
The weekly chart has been building momentum since breaking the downtrend line two months ago and reclaiming the 40-week MA. The 10-week MA is in a strong uptrend and has recently crossed above the 40-week MA (bullish crossover signal).
$NKY is currently forming the handle portion of the pattern, which is four weeks in length. A test of the rising 10-week MA on a pullback over the next week or two would be an ideal entry point.
iShares Malaysia ETF ($EWM), which we are currently long in the ETF portfolio continues to trade in a tight range over the past few months, just below the highs of a year long base.
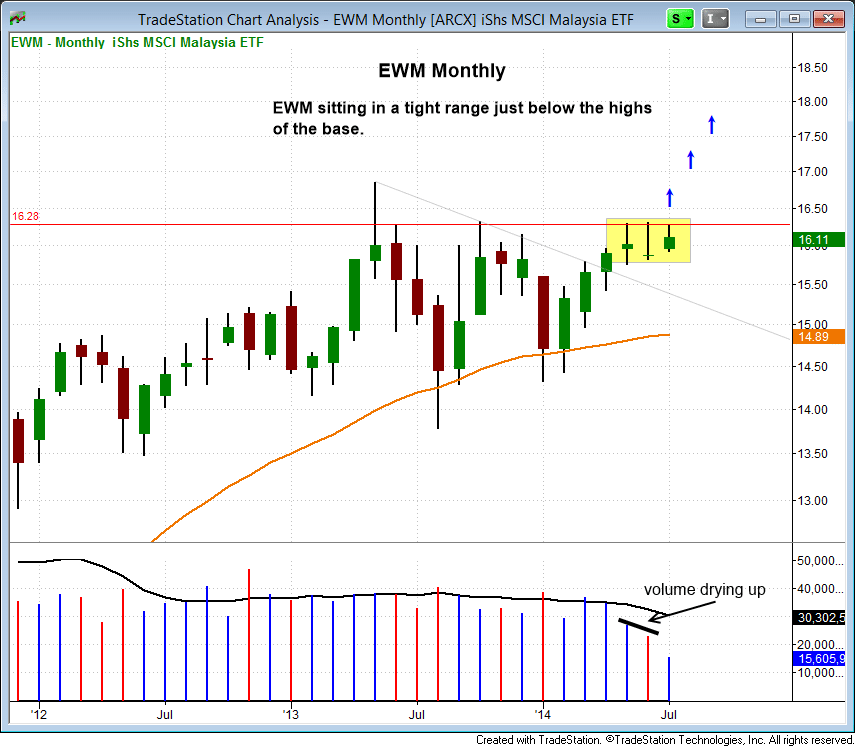
A breakout above the three month high on volume should lead to new 52-week highs in short order. There is no resistance above $17, so the chart has plenty of room to run.
On the stock side, we added one new position in $LEAF as it cleared last week's high, and sold $SANM for a 7% gain.
For the most part, our A rated stock scans have dried up the past few days. There are some trades out there in momentum names with strong relative strength; however, many of these companies will report earnings within the next week or two.
$TSEM, one of our current positions in The Wagner Daily, finally broke out and ran about 13% higher on big volume. We are looking for a move to $14 as the target.
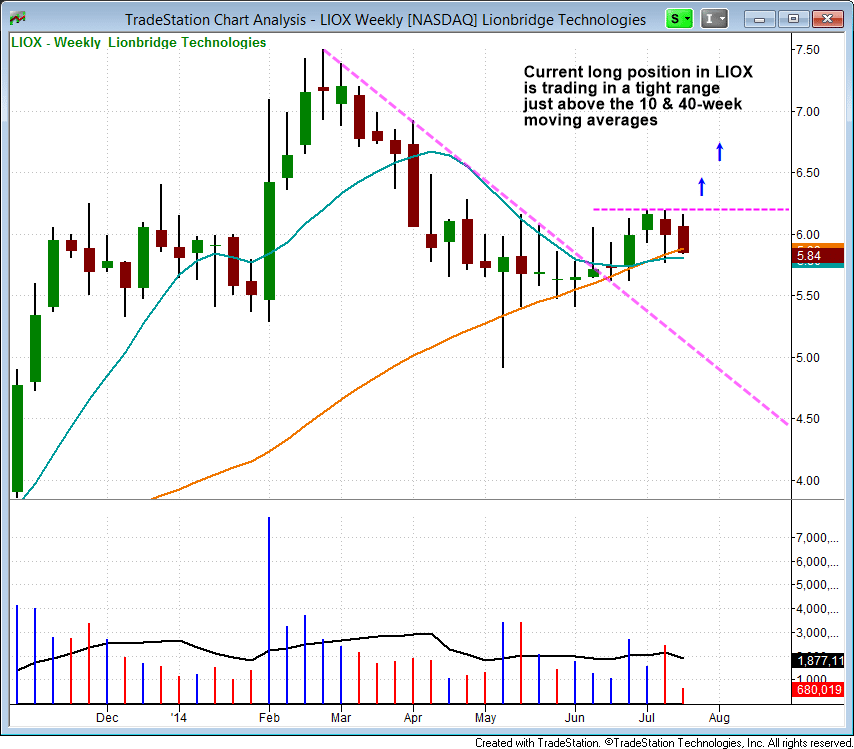
Lionbridge Technologies ($LIOX) is a current long position in the stock portfolio that we entered on July 3 at $6.15. Although the price action has yet to follow through, it remains in a tight range above the 10 and 40-week MAs. A breakout above the three-week high should lead to a test of the prior swing high. The target is the $8.50 to $10 area, where there is resistance on the monthly chart:
Deron Wagner is the Founder and Head Trader of both Morpheus Capital LP, a U.S. hedge fund, and MorpheusTrading.com, a trader education firm.
|


 Free Festival of Traders Videos