| The Wagner Daily ETF Report For July 14 |
| By Deron Wagner |
Published
07/14/2014
|
Stocks
|
Unrated
|
|
|
|
The Wagner Daily ETF Report For July 14
The market failed to follow through on last Thursday's bullish reversal action, but the main averages held above Thursday's low, which is a key short-term support level.
The Nasdaq Composite and Nasdaq 100 continue to outperform in a strong uptrend, while holding above the rising 10-day moving averages. However, a break of last Thursday's low would likely result in the Dow Jones and S&P 500 closing below their 20-day exponential moving averages, which would suggest a few weeks of choppy action to digest the recent stock market advance.
Moving averages are a very simple, yet highly effective tool when analyzing the strength of a trend. When the price action is above the 10-day moving average, and the price and moving average are trending higher, it is an ideal situation (potentially explosive uptrend).
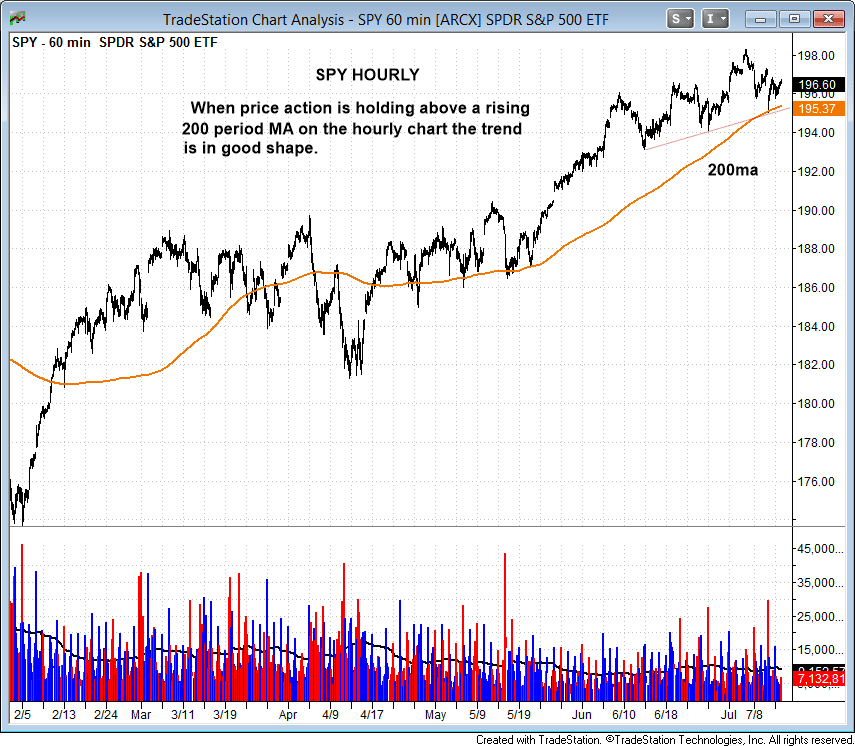
The 20-day EMA is our line in the sand when a stock or ETF is in breakout mode. We use the 200 period moving average on the hourly chart, in tandem with the 20-day EMA, as it is a bit more forgiving with the price action.
For example, if the price breaks below the 20-day EMA on the daily chart, but holds the 200-period MA on the hourly chart, then the uptrend is still intact in the short-term. Nothing really good happens to a stock when the price is below the 200-period MA on the hourly.
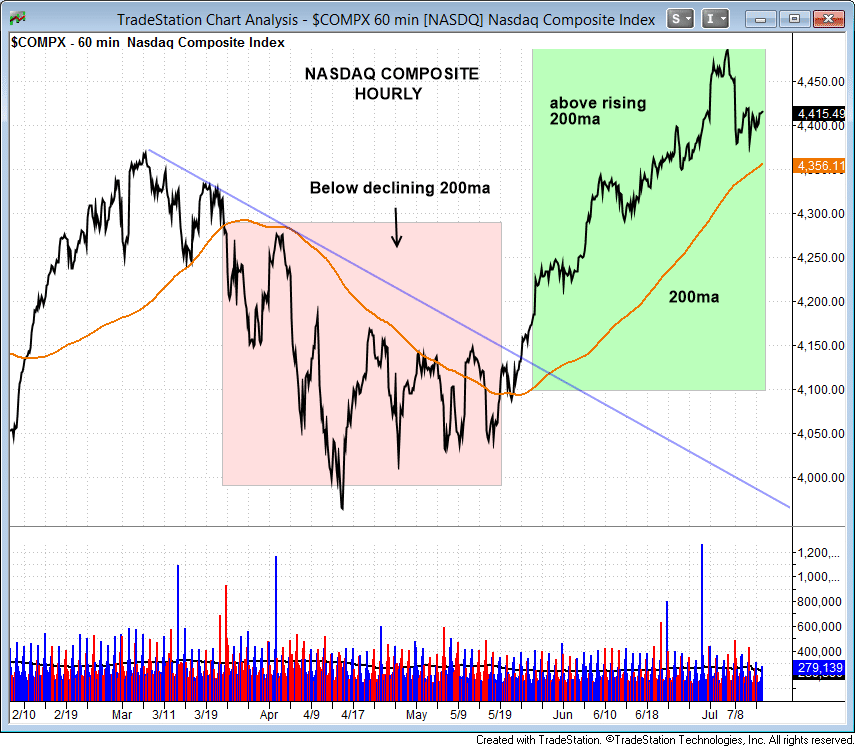
Looking at the hourly charts of the S&P 500 ETF ($SPY) and Nasdaq Composite below, notice the price action is still holding above a rising 200-period MA, though a break below $195 in the $SPY would put the chart in short-term trouble and potentially lead to a pullback to the $193 area:
Earnings will definitely play a big role over the next few weeks, especially in late July and early August when several top notch growth stocks report.
Nine times out of ten, we avoid taking a new setup in our newsletter if earnings is three to ten days ahead because there isn't enough time to build a profit buffer before the report. Still, if you watch the market intraday, taking a position ahead of the report is possible when using a very tight stop with the expectation of an immediate move higher.
We also do not mind waiting for a favorable reaction to earnings in the form of a morning gap to new 52-week highs on big volume, as this typically is a big buy signal.
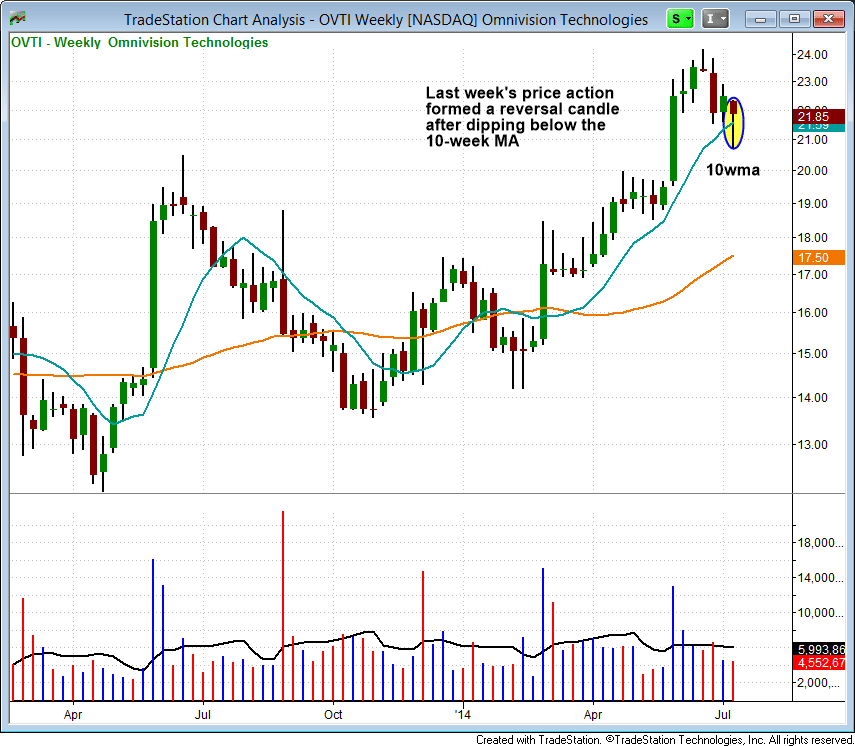
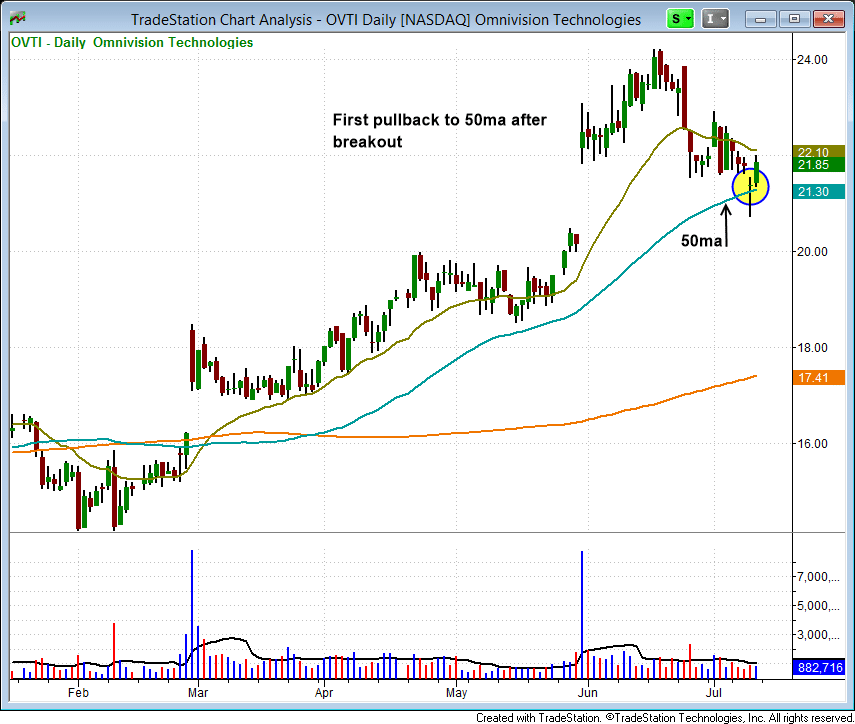
On the stock side, we have one new buy setup today, which is Omnivision Tech ($OVTI). The stock pulled back into the rising 50-day moving average (or 10-week moving average) late last week.
The weekly chart details the move up and bullish reversal candle off the rising 10-week MA.
The first pullback to the rising 50-day MA is usually a decent spot to add to an existing position, or as a low-risk first entry after missing a quality breakout:
Wagner Daily subscribers should note our exact buy trigger, stop, and target prices for this setup in the "Watchlist" section of today's report.
Deron Wagner is the Founder and Head Trader of both Morpheus Capital LP, a U.S. hedge fund, and MorpheusTrading.com, a trader education firm.
|


 Free Festival of Traders Videos