| The Wagner Daily ETF Report For July 9 |
| By Deron Wagner |
Published
07/9/2014
|
Stocks
|
Unrated
|
|
|
|
The Wagner Daily ETF Report For July 9
Stocks followed through on Monday's weakness and produced a clear cut distribution day in the major averages. The S&P 500 and Nasdaq Composite dropped -0.7% and -1.4% respectively on higher volume. The timing model remains in buy mode, but another day of distribution this week would be cause for concern.
The only average to breakdown technically was the Russell 2000, which lost the 20-day EMA. As mentioned yesterday, the stalling at the highs and Monday's selling suggests that the Russell will chop around for a few weeks, as it digests the last advance off the 200-day MA. At the very least, the price action should hold above the rising 50-day MA as it consolidates.
The other averages remain above the 20-day EMA, but given the past two days of selling, we may see a few weeks of chop around this average into earnings season, which heats up towards the end of the month and in early August.
Although some leading stocks took a bit of a hit on Tuesday and may need some work in the short-term, most leading charts are still in decent shape on the weekly, which is a good sign. How these stocks close out the week should provide us with more clues. Will leading stocks bounce off support levels or stay glued to the lows of the week?
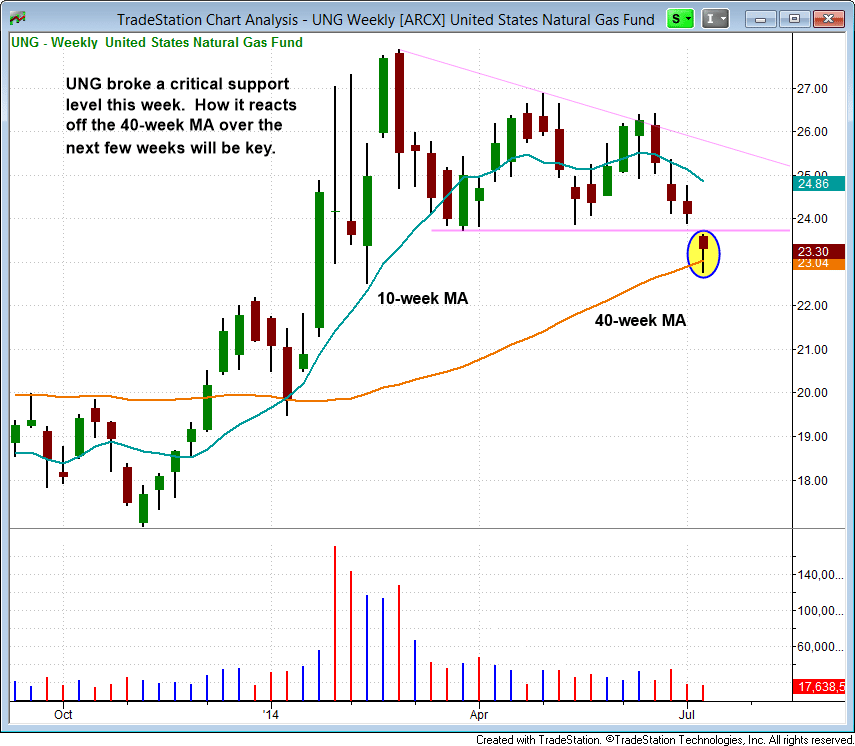
Earlier this week, we stopped out of our position in natural gas ETF ($UNG), as it broke a pivotal support level just under $24. However, we will continue to monitor the action on the weekly chart to see if $UNG can quickly recover off the lows and reclaim the $24 level. Such a move could potentially take place next week, if it can form a bullish reversal candle this week.
Tesla Motors ($TSLA) put in a bullish reversal candle on Tuesday, with volume picking up over the past few days. The price action may have to pull in to the 50-day MA before heading higher, but if Tuesday's low holds, then it could form a handle and work its way higher while holding the uptrend line over the next few days.
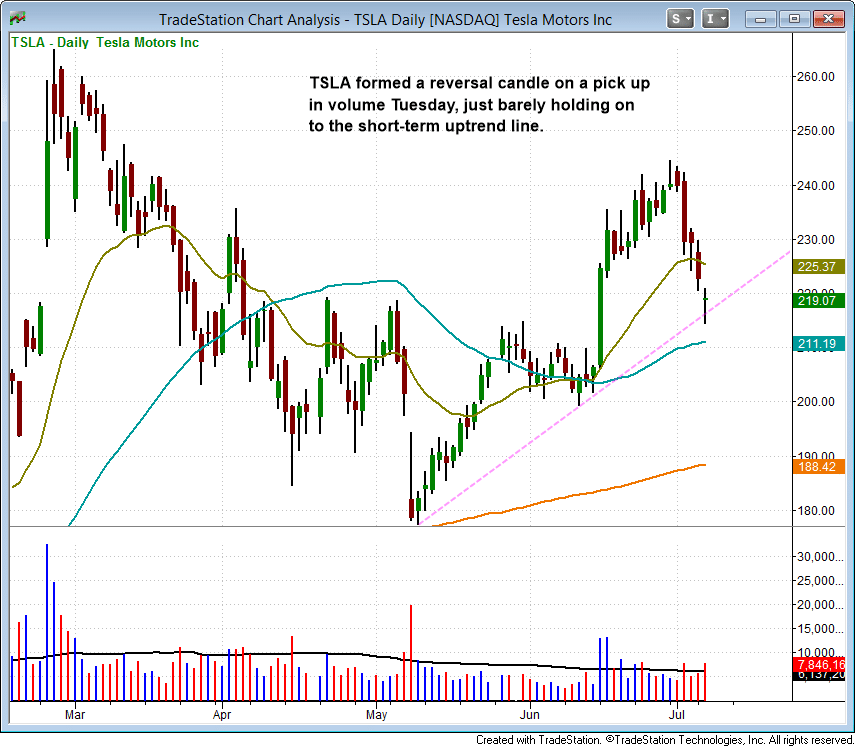
We are placing $TSLA on today's watchlist. Subscribing members of The Wagner Daily should note our exact buy trigger, stop, and target prices in today's newsletter.
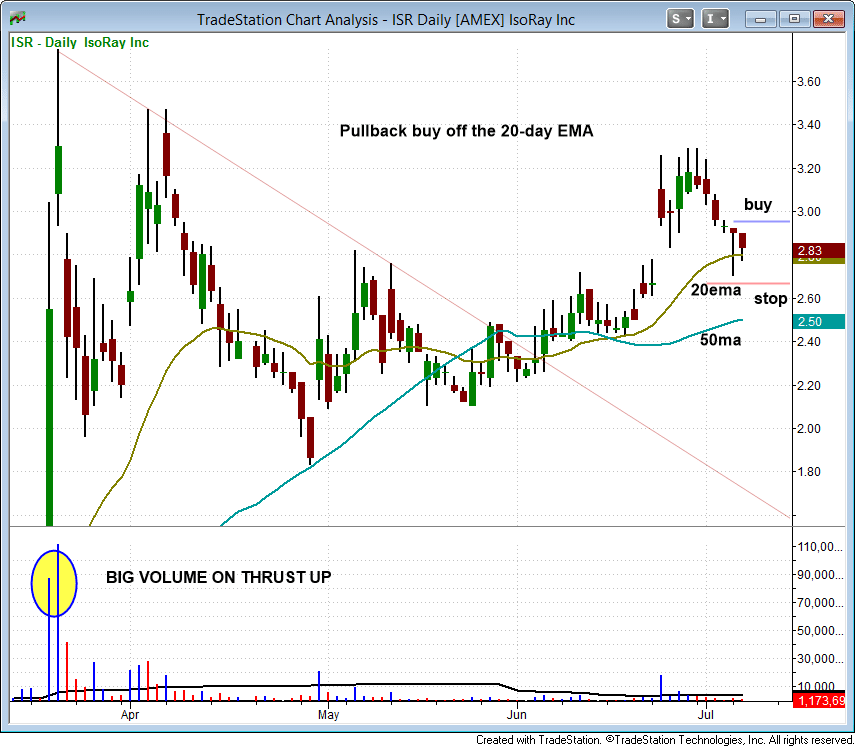
Our second setup is in IsoRay ($ISR), which we are stalking for a pullback entry off the 20-day EMA. This is basically a blast off setup, where $ISR ripped through the 50-day MA on a big spike in volume a few months ago. After breaking the downtrend line, the 20-day EMA crossed above the 50-day MA, with higher lows along the base.
The recent pullback has been on declining volume, with Monday's reversal finding support at the 20-day EMA.
Deron Wagner is the Founder and Head Trader of both Morpheus Capital LP, a U.S. hedge fund, and MorpheusTrading.com, a trader education firm.
|


 Free Festival of Traders Videos