| The Wagner Daily ETF Report For June 10 |
| By Deron Wagner |
Published
06/10/2014
|
Stocks
|
Unrated
|
|
|
|
The Wagner Daily ETF Report For June 10
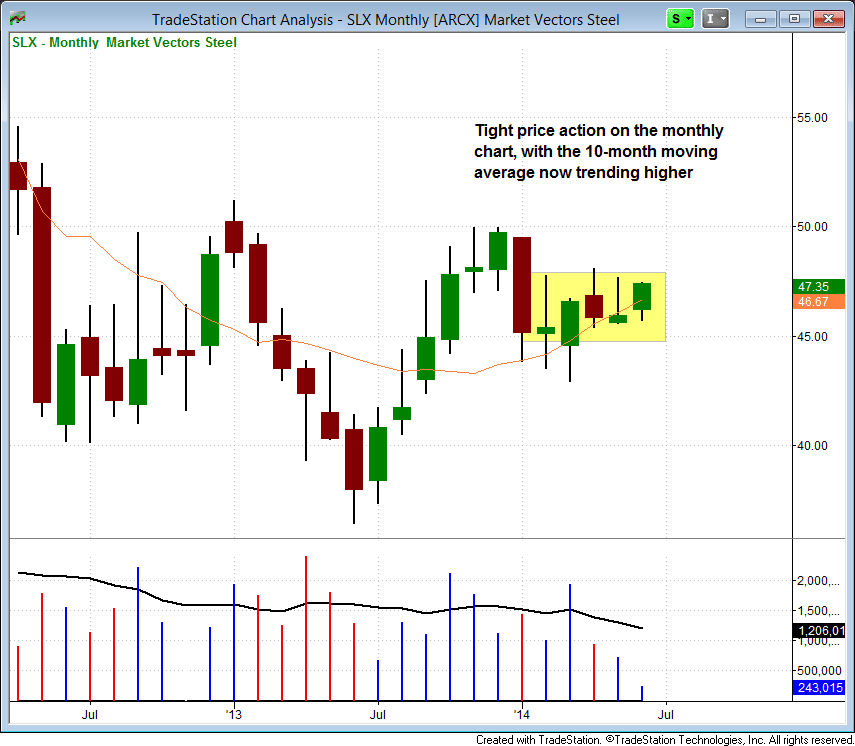
After a strong surge off the lows of 2013, Steel ETF ($SLX) stalled around $50 and has since formed a bullish consolidation above the rising 10-month moving average, with volume declining the past few weeks:

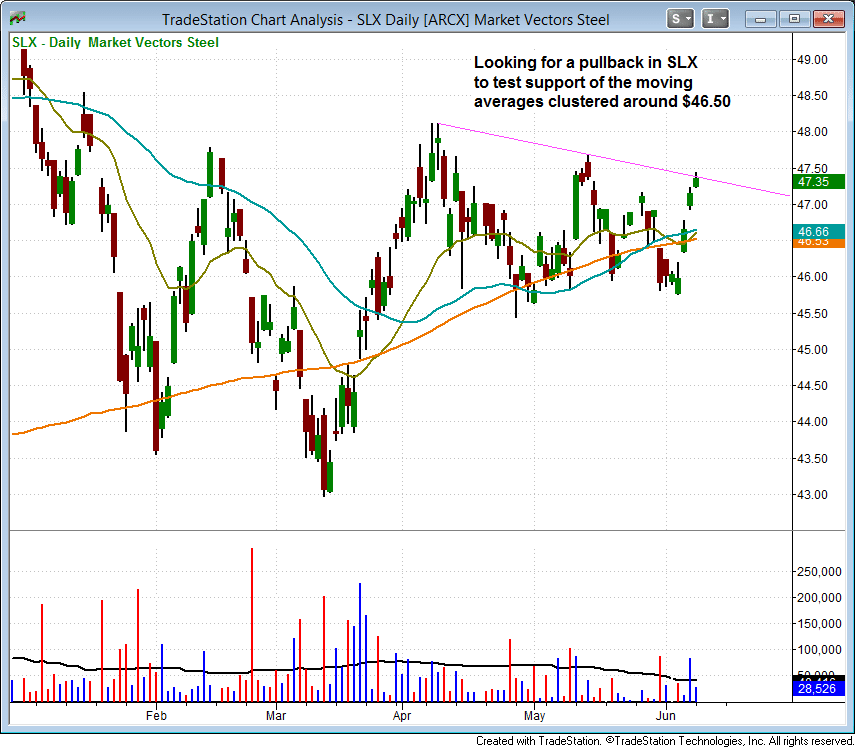
The daily chart shows the current basing action holding above all three major averages in April, May, and June, with a few bullish shakeouts along the way.
$SLX has rallied up to the short-term downtrend line, but we are waiting for a low-risk entry point to develop (on a test of the moving average support level around $46.50):

$SLX should hold above $45.50 for the setup to remain in play in the short-term. A clear break of $45 may not kill the pattern, but would certainly require a few weeks of consolidation to repair the damage.
As always, subscribers of The Wagner Daily should note our exact entry, stop, and target prices for the $SLX setup in today's report.
On the individual stock side, we do not have any new setups for today, but we did change the position sizing for our Tesla ($TSLA) long setup to 40%. We added two new positions to the portfolio yesterday, and our existing position in $IDTI followed through nicely to the upside.
Recent stalling action on the daily chart of the S&P 500 suggests that the uptrend may need some rest IF the price confirms with a clear breakdown below Monday's low.
Along with the S&P 500, the Russell 2000 may be due for a few days of rest as it approaches important resistance from the high of January at 1,182. There was also some stalling action in the semiconductor ETF ($SMH), as it closed near the lows of the day on heavy volume. Again, these one-day reversal signals on candlestick charts do need to be confirmed.
Deron Wagner is the Founder and Head Trader of both Morpheus Capital LP, a U.S. hedge fund, and MorpheusTrading.com, a trader education firm.
|