| The Wagner Daily ETF Report For April 14 |
| By Deron Wagner |
Published
04/14/2014
|
Stocks
|
Unrated
|
|
|
|
The Wagner Daily ETF Report For April 14
Stocks closed near the lows of the session on Friday after attempting to push higher in the morning. The weekly candles look pretty ugly across the board, with all indices closing near the lows of the week on higher volume.
The Dow Jones and S&P 500, which have been relatively strong finally broke down below the 10-week MA on higher volume. Major sector ETFs that were showing relative strength also closed below the 10-week MA, such as financial ETF ($XLF) and transportation ETF ($IYT).
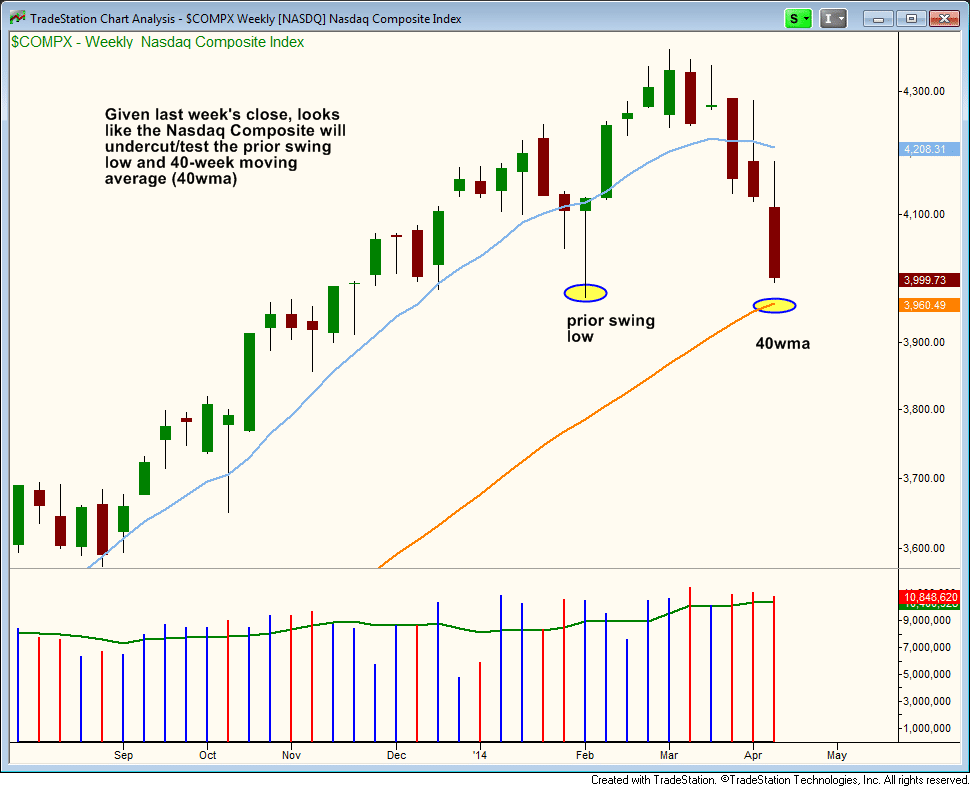
The ugly weekly candle in the Nasdaq Composite suggests that the index will probably touch the 40-week MA and undercut the prior swing low before heading higher. We could possibly see this happen earlier in the week, followed by some sort of bounce from oversold conditions by the end of the week:
Last Friday, we bought the Gold Miners Bear 3x ($DUST) over the two-day high. By going long the inverted $DUST, we are able to short gold mining stocks in qualified (non-marginable) accounts. This is a swing trade that could take a few weeks to play out, depending on how $DUST acts if/when it touches the prior swing high.
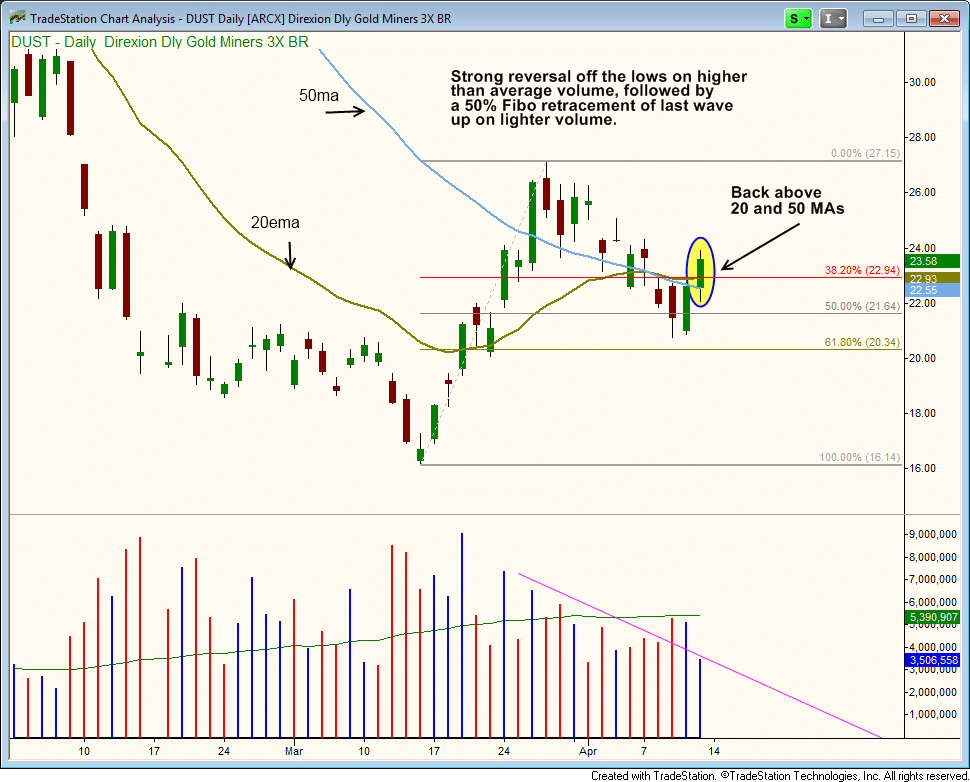
Friday's close in $DUST puts it back above the 20-day EMA and 50-day MA after finding support just below the 50% Fibo level at $21.64.
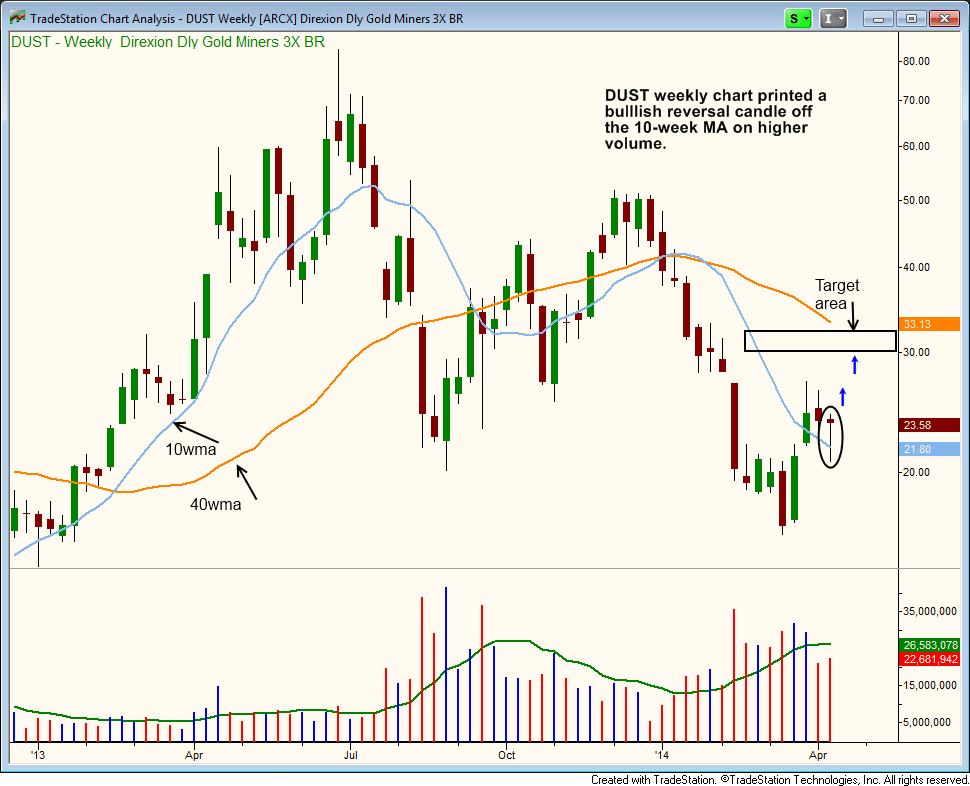
The weekly chart of $DUST shows a bullish reversal candle on higher volume. We are looking for a move to the $30-$32 area:
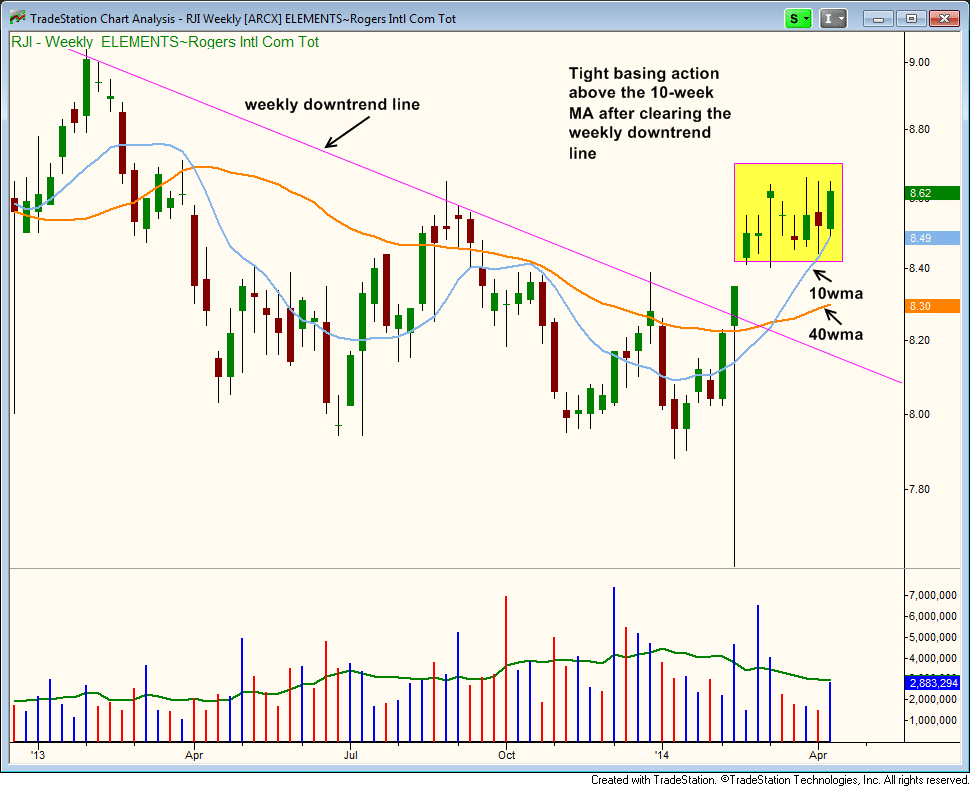
For those who have not already entered Rogers International Commodity Index ($RJI), the price and volume action remains bullish, and we are long from last week's entry.
$RJI has formed a pretty tight base after breaking the weekly downtrend line. The 10-week MA crossed above the 40-week MA five weeks ago, which is a bullish trend reversal signal. Both the 10 and 40-week MAs are now trending higher.
Last week's move off the 10-week MA was on a pick up in volume, with the price closing near the highs of the week.
We are content to hold on to commodity based longs in the ETF portfolio while patiently waiting for new short setups to emerge in equity based ETFs. Market conditions continue to deteriorate, so we see no reason to buy any industry group ETFs on weakness.
We haven't had much to talk about on the long or short side as of late. We do not expect that to be the norm, but one should also not strive to trade every single wave in the market.
The goal here is to remain patient and wait for new short setups to develop with low risk entry points.
Deron Wagner is the Founder and Head Trader of both Morpheus Capital LP, a U.S. hedge fund, and MorpheusTrading.com, a trader education firm.
|


 Free Festival of Traders Videos