| The Wagner Daily ETF Report For April 10 |
| By Deron Wagner |
Published
04/10/2014
|
Stocks
|
Unrated
|
|
|
|
The Wagner Daily ETF Report For April 10
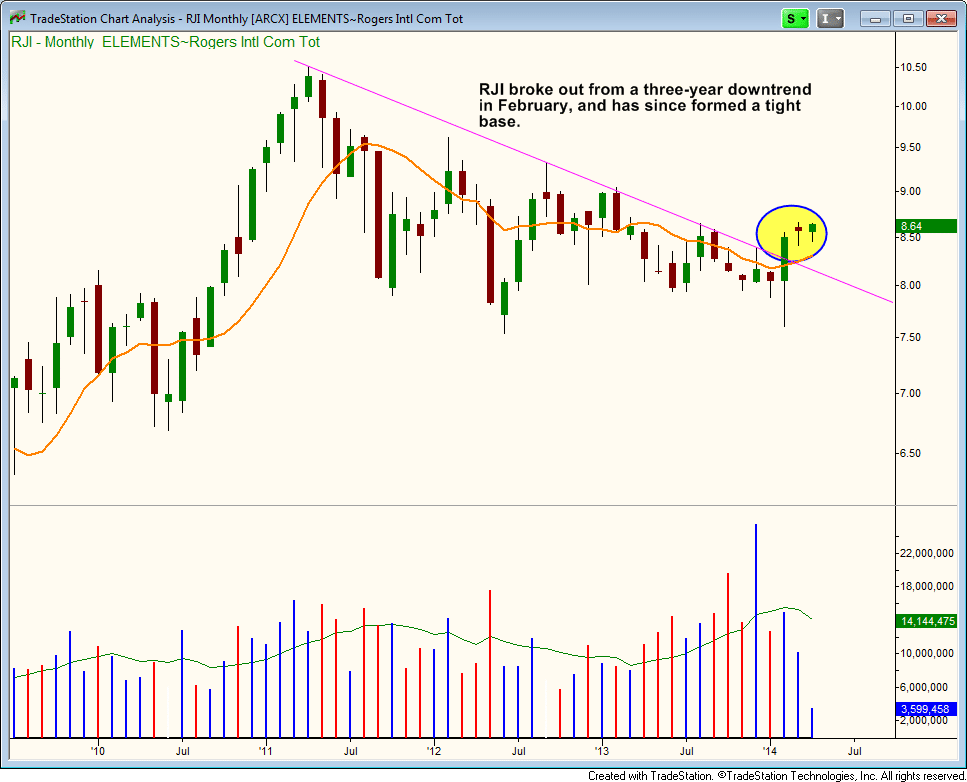
On the ETF side, we added one new position to our Wagner Daily holdings yesterday in $RJI (Rogers International Commodity Index). About 30% of its weighting is in oil, but that is fine with us because $USO looks like it could go on a decent run.
$RJI broke out above a three-year long downtrend line a few months ago, and has since been consolidating around $8.50 in a tight range. Although it may be tough to see, the 10-month moving average (orange line on chart below), which is a bullish sign:
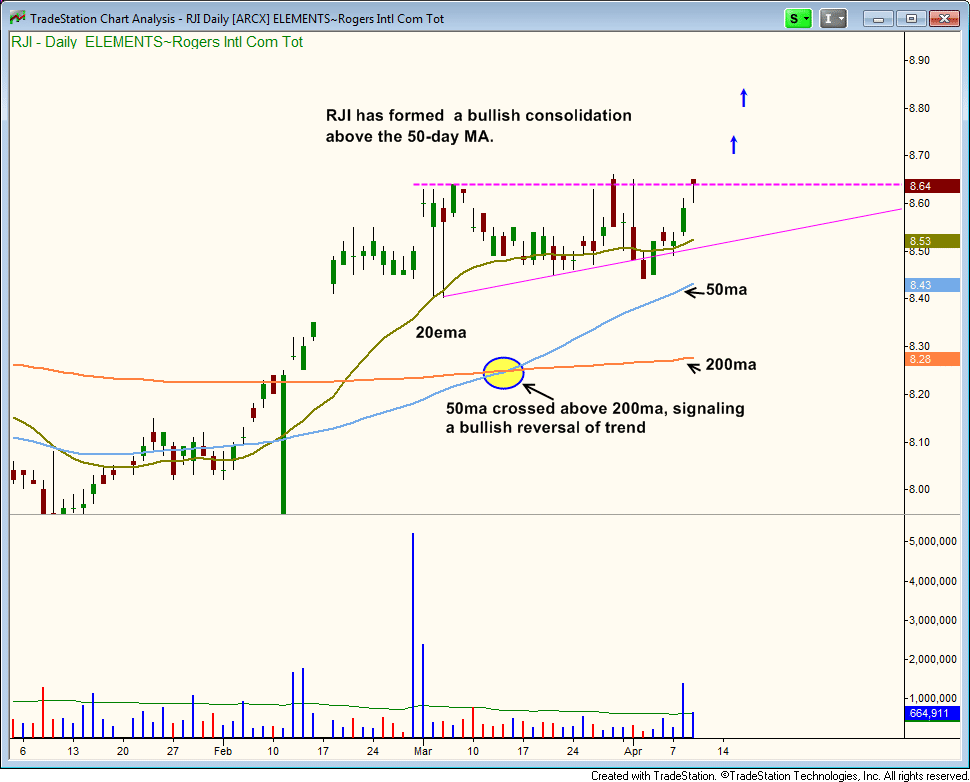
Since stalling out at the beginning of March, $RJI has formed a tight range while holding above the 50-day MA and 20-day EMA (for the most part).
Note that the 50-day MA recently crossed above the 200-day MA (see chart below), which is a bullish, intermediate-term trend reversal signal.
With the 20-day EMA, 50-day MA, and 200-day MA trending higher, $RJI may soon be ready to breakout:
Sticking with commodity based ETFs, Lithium ETF ($LIT) continues to find support at the rising 10-week MA on its way to forming a bullish base.
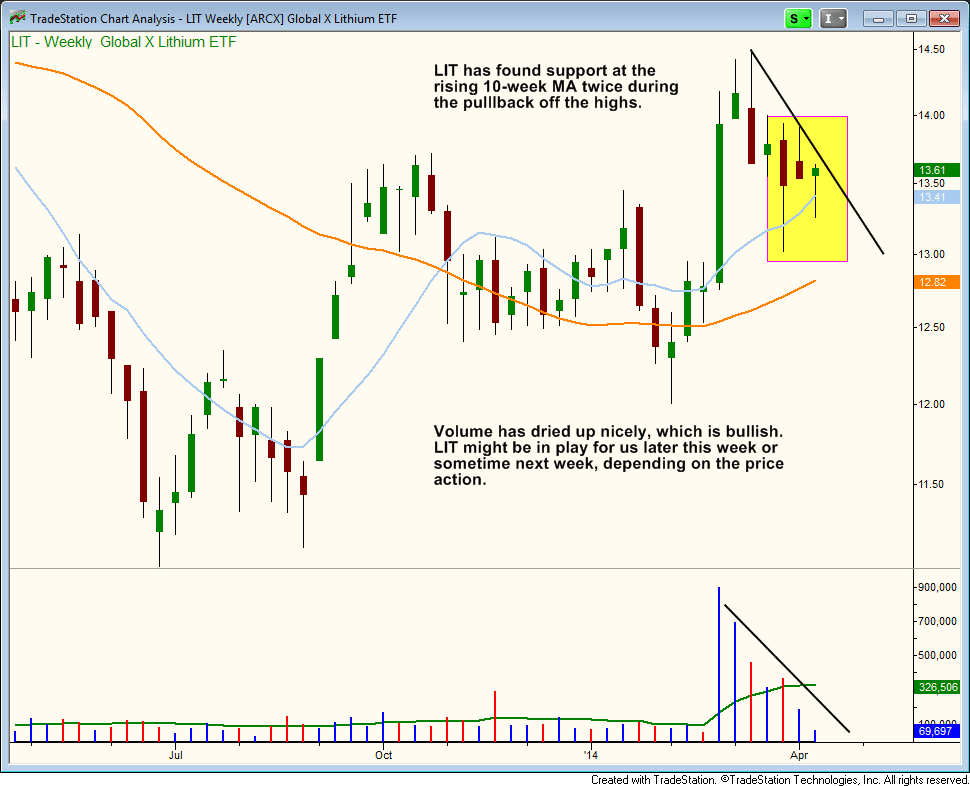
After a big shakeout candle below the 10-week MA two-weeks ago, the price action looks to have tightened up the past two-weeks. If $LIT remains in a tight range through the end of the week, then a move above this week's high within the coming week would be a low-risk entry point.
We also continue to stalk Gold Double Long ETF ($DGP) for potential buy entry (subscribers to our trading newsletter should note our exact trade details in the "Watchlist" section of today's report), and are also monitoring a few gold stocks for possible long entry.
In yesterday's report, we mentioned that if the S&P 500 was weak, it may find resistance in the $186 to $187 area, which is where it closed on Wednesday. The resistance in the SPY is nowhere near as significant as the Nasdaq because the S&P 500 has yet to break down below its 50-day moving average. The daily chart of $SPY is actually in good shape and could easily breakout to new highs within the next few sessions.
The market could be developing a scenario where most leading NASDAQ stocks continue to struggle, while big cap stocks help lift the S&P 500 to new 52-week highs.
NASDAQ leadership might bounce higher in the short-term, but most patterns of the top stocks are broken and will need time to heal. In the meantime, old school names like $MSFT, $ORCL, and $INTC are leading, which isn't a great sign for the market. Nevertheless, it could help prop up the NASDAQ.
Deron Wagner is the Founder and Head Trader of both Morpheus Capital LP, a U.S. hedge fund, and MorpheusTrading.com, a trader education firm.
|


 Free Festival of Traders Videos