| The Wagner Daily ETF Report For April 9 |
| By Deron Wagner |
Published
04/9/2014
|
Stocks
|
Unrated
|
|
|
|
The Wagner Daily ETF Report For April 9
The S&P 500 could be due for a bounce this week, after undercutting the lows of the current range, which typically happens after a false breakout.
If the S&P 500 is weak, then it shouldn't retrace much more than 50% to 61.8% of the last wave down, which would put the S&P 500 SPDR ($SPY) around the $186.60 - $187.40 area. Note there is also overhead resistance from the 20-day EMA around $186.
On the intraday charts, there is resistance from the 200-period moving average on the 60-minute chart, just below $187. On the 15-minute time frame, the 200-period MA is also just below $187. So there is quite a bit of resistance clustered around the $186 - $187 level:

After forming a double bottom in January, gold ETF ($GLD) rallied 16% before stalling out beneath the last swing high in September.
Gold looks to have found support the past few weeks, after undercutting the 40-week MA and the 50% Fibo level, while the 10-week moving average crossed above the 40-week MA. The 40-week MA has also just turned up after flattening out for a few weeks:
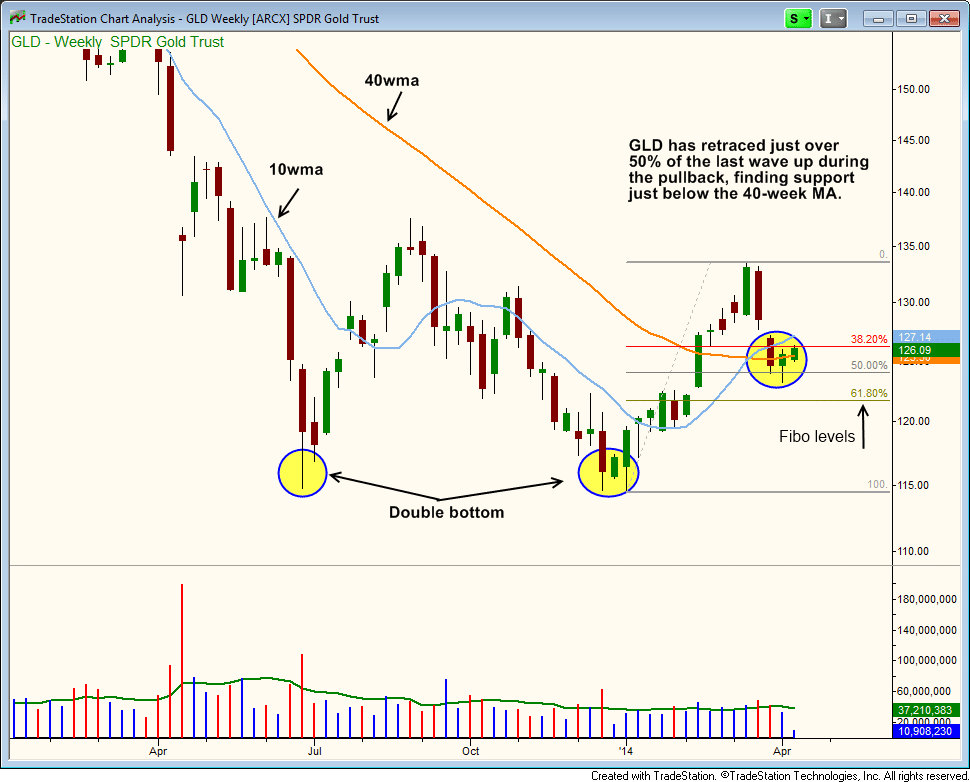
We like $GLD as a potential trend reversal play above last week's high. To confirm the reversal, $GLD eventually will have to clear the highs of March.
Rather than buying $GLD, we will look to enter the leveraged gold ETF $DGP. Subscribers of our nightly stock and ETF report should note our exact buy trigger, stop, and target prices for the $DGP setup in the "Watchlist" section of today's newsletter.
Natural Gas ETF ($UNG) continues to consolidate in bullish fashion with the lows of the current base holding above the prior swing high. The 10-month moving average has turned up and has been trending higher:
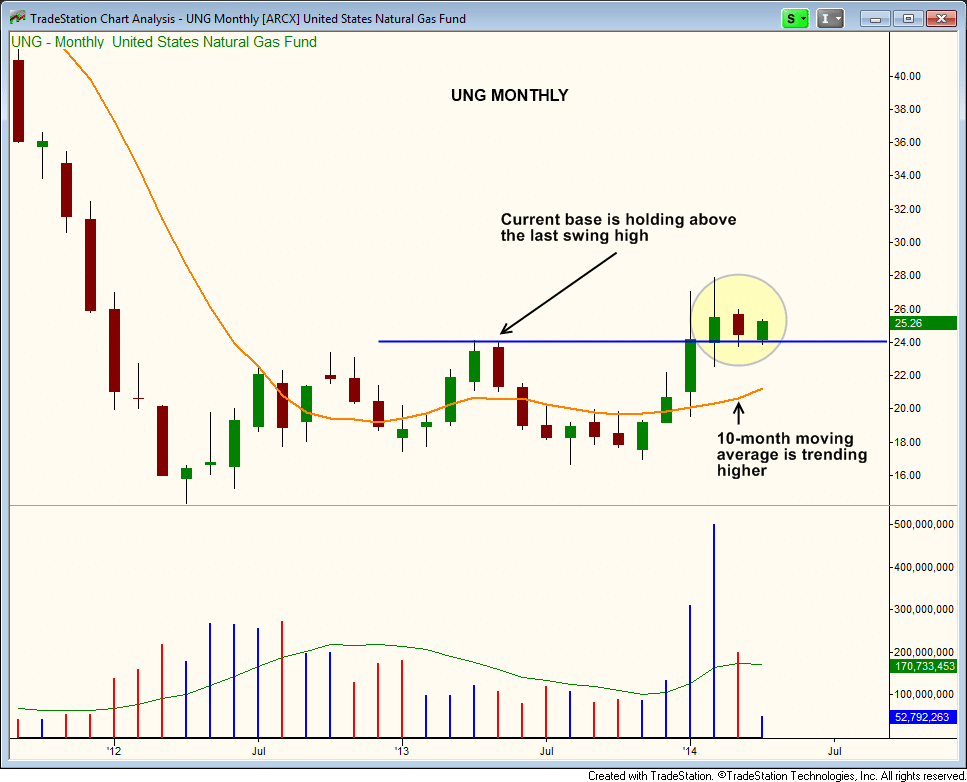
On the weekly chart, $UNG has recently undercut the rising 10-week MA, but is attempting to reclaim the average this week. The volume has tapered off during the base (bullish), and the price action has tightened up in the base after several weeks of volatility in late January and February:

$UNG is acting like it wants to go higher. Whether that move is right away (scenario A on the chart above), or there is one more undercut of the 10-week MA and then a move up (scenario B) we do not know. We are already long $UNG in our ETF portfolio.
Deron Wagner is the Founder and Head Trader of both Morpheus Capital LP, a U.S. hedge fund, and MorpheusTrading.com, a trader education firm.
|


 Free Festival of Traders Videos