|
The Wagner Daily ETF Report For April 8
With bearish momentum increasing and stocks testing key support levels in recent days, one of the biggest questions on your mind may be whether or not recent price action is merely a normal bull market correction OR the beginning of a dominant bearish trend reversal.
If I had the power to know these things with 100% certainty, I would already be topping the Forbes 400 list (incidentally, never believe anyone who tells you any "certainties" about the stock market).
But what I can tell you with the utmost confidence is that basic technical analysis concepts such as support and resistance definitely work a majority of the time at predicting the stock market's next move.
As such, let's take a look an objective, "no nonsense" look at the next major, long-term support levels in both the NASDAQ 100 and S&P 500 indices (using ETF charts of $QQQ and $SPY).
NASDAQ 100 ETF - $QQQ
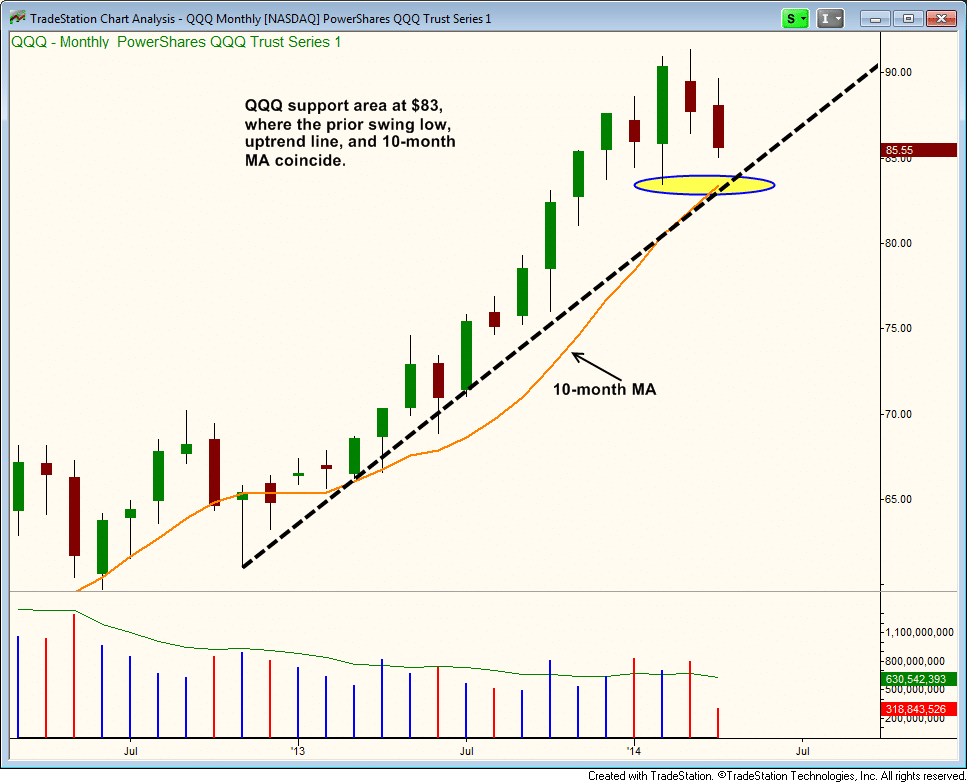
In my April 7 blog post (definitely worth a read if you missed it), I already showed you the $83 support level in $QQQ (convergence of the February swing low, dominant uptrend line, and 40-week/200-day MA).
If $QQQ breaks down below that pivotal level of support around the $83 area, it would put the NASDAQ 100 at least 9-10% below its recent 52-week high.
In a bull market, a "normal" and healthy pullback from the highs typically in the 5-10% range. Therefore, if $QQQ slides more than 10% below its March 2014 highs, price action in the NASDAQ could become quite negative for at least the next several months:
Next, let's pan out to a longer-term view on the same monthly chart that goes all the way back to the lows of 2009.
In doing so, you can more clearly see the importance of that long-term uptrend line, which has been in place for the past five years and has multiple anchor points along the way:
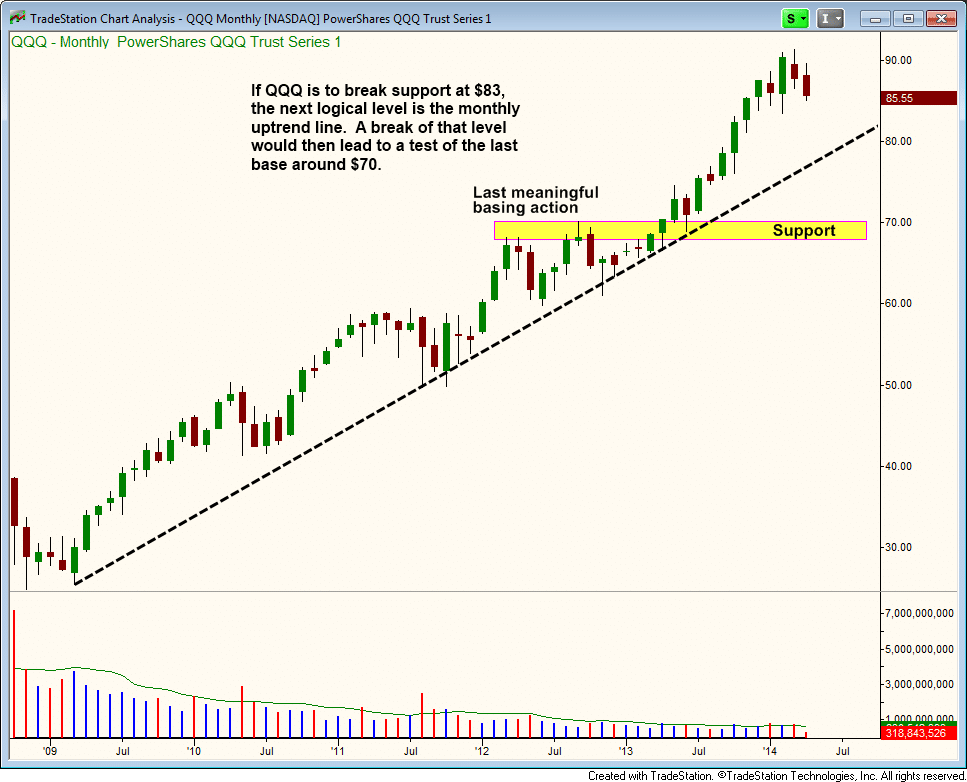
If you want to know when to expect a major change in market sentiment, I recommend you watch this 5-year uptrend line closely, as a breakdown below that level could lead to a new bear market in the NASDAQ.
However, even if a break of the long-term trendline occurs, this scenario might not play out until 2015 because we are looking at a chart of the monthly time frame (each bar on the chart shows an entire month of price action).
If the 5-year uptrend line is broken, the next major support level would be found around $70, which is the last big base of price consolidation.
A test of consolidation at the $70 area would "officially" put the NASDAQ 100 in a bear market, as it would be 20% below its former 52-week high.
S&P 500 ETF - $SPY
In the near-term, $SPY (S&P 500) is in better technical shape than $QQQ (NASDAQ 100), as it isn't still well above support of its prior swing low from February.
Further, the price of $SPY must break below support of a multi-year uptrend line, as well as the 10-month/200-day MA, just to pullback to the February swing low:
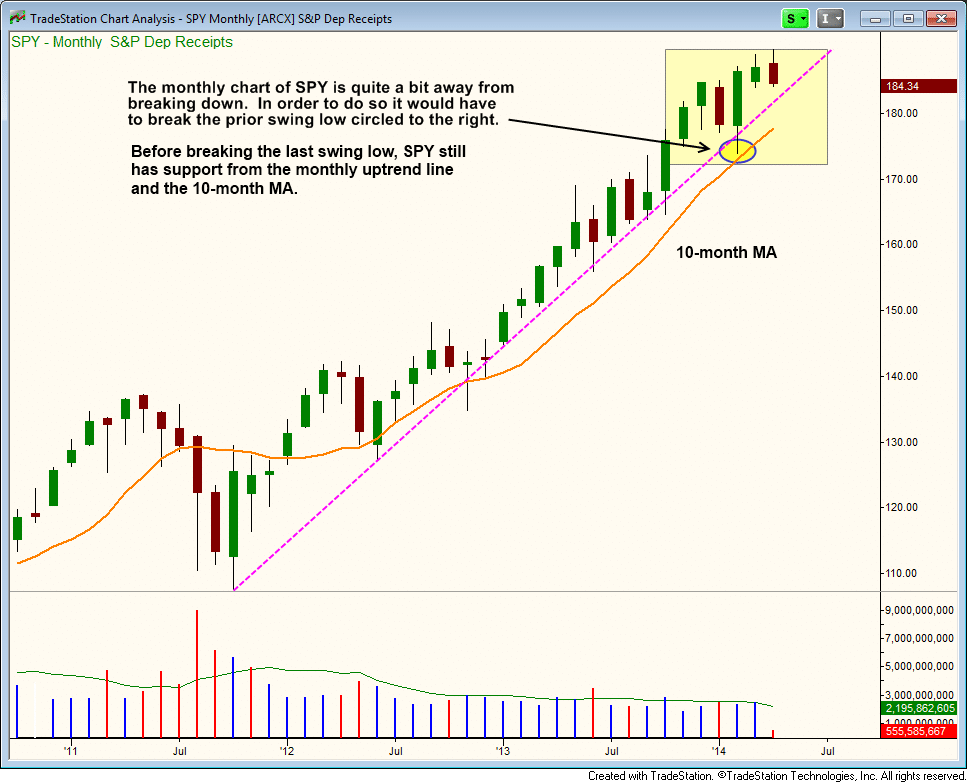
Although the S&P has further to fall before being in danger of breaking its swing low, bearish momentum could indeed kick into high gear if that February swing low fails to hold.
If that occurs, the next decent support level for $SPY would be around the $165 to $170 area, where there was a five-month long base in 2013.
Beyond that, the next major support level for $SPY is near the $155 level, which is support of the prior highs from 2000 and 2007 (not shown on chart). Remember that a prior level of resistance technically becomes the new support, after the resistance is broken.
Still, as with the NASDAQ 100, bear in mind that a pullback of this magnitude would most likely not occur until 2015, and would also put $SPY about 18-20% off its 52-week high.
What If The Bull Has Run Its Course?
A clear breakdown below the last major swing lows in the main stock market indexes would make for a very tough year for the equities markets, but it would not be very surprising.
Considering that the stock market has already been rallying for five years since the lows of 2009, it is very possible the bull market has already run its course (every stock market runs in cycles).
Overall, it's starting to look as though the rest of 2014 could be quite choppy, followed by an ugly 2015 (if the charts break down on all time frames).
If stocks enter into a new bear market in 2015, it would obviously bad news for traditional "buy and hold" investors who must hope and pray that stocks continue on an upward trajectory forever (hint: they don't).
However, a new bear market would not bother me because I am a momentum swing trader; the trading system taught in my nightly stock trading newsletter is designed to profit in both uptrending and downtrending markets.
Bear Market Strategy (Just In Case)
In bull markets, my main focus is buying leading growth stocks as they breakout from valid bases of consolidation (as well as buying those same stocks on pullbacks).
But in bear markets, my strategy is a combination of selling short former leadership stocks as they break down (click here to see how it's done) and buying ETFs with low to nill correlation to the equities markets (such as commodities, currencies, fixed-income, and international).
When selling short in a bear market, I scan for former leadership stocks that had a strong rally over the course of several years, but have begun to fall apart and take a beating.
Most of the time, these stocks are about three to four months removed from their 52-week highs, and their 50-day moving averages are beginning to roll over as well.
The general idea is to sell short a former leader that is over-owned by institutions, as it begins to rollover from the highs.
Because banks, mutual funds, hedge funds, and other institutions need to dump the huge positions they had accumulated, some of these monster movers will plummet up to 75% below their all-time highs before they stabilize in price.
Coach - Stalking For A Breakdown
Coach ($COH) is a decent example of what I would be looking for in selling short a former leading stock (though it has not actually broken down yet).
After bottoming out in 2009, $COH put in a monster 500% rally off those lows.
It subsequently stalled out in 2012, and has basically been chopping around since then, forming lower highs while holding support at $45. This is shown on the monthly chart of $COH below:
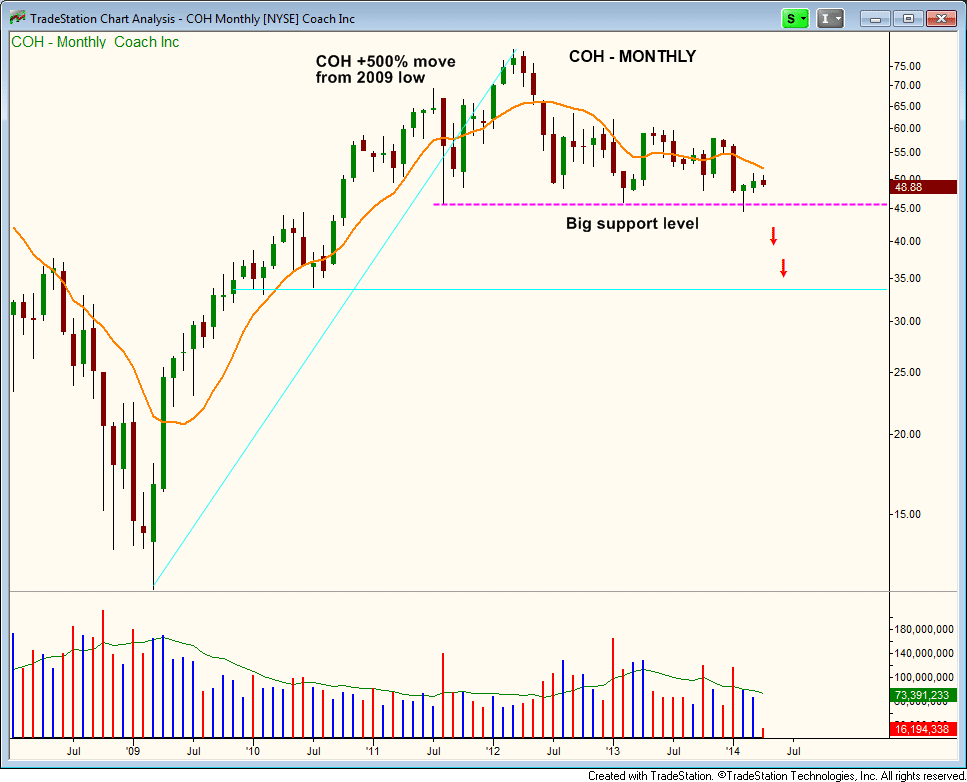
As indicated by the pink horizontal line, the $45 area has become a major level of price support.
As such, $COH could easily drop to $30 in just a few weeks if the $45 level is broken.
Although $COH has already pulled in about 40% off its all-time high, it could easily become a $20 stock if support does not hold.
In the big picture, it is still a bit early to be aggressively stalking the short side of the market, but $COH is one of the stocks on my internal watchlist for potential short selling entry in the near-term.
If $COH meets my specific criteria for a low-risk short selling entry point, I will provide subscribers of The Wagner Daily newsletter with my exact entry, stop, and target prices for the momentum trade setup.
Obviously, many other former leadership stocks will come onto my radar screen as well, providing for plenty of opportunities to profit on the short side of the market.
I look forward to the opportunity to help my subscribers continue to generate consistent trading profits, even if a new bear market is on the horizon.
Deron Wagner is the Founder and Head Trader of both Morpheus Capital LP, a U.S. hedge fund, and MorpheusTrading.com, a trader education firm.
|


 Free Festival of Traders Videos