|
The Wagner Daily ETF Report For February 10
As anticipated, stocks were quiet ahead of today's expected Senate vote on the latest economic stimulus bill. The main stock market indexes oscillated in a narrow, sideways range throughout the day before finishing near the flat line. The S&P 500 eked out a 0.1% gain, as the Dow Jones Industrial Average dipped 0.1%. The Nasdaq Composite was unchanged. Small and mid-cap stocks, which turned in the strongest performance the previous day, pulled back modestly. The Russell 2000 declined 0.6% and the S&P Midcap 400 eased 0.2%. The major indices settled just above the middle of their intraday trading ranges.
In yesterday's commentary, we said, "...institutions may be inclined to wait out today's session on the sidelines." That's exactly what happened, as turnover fell to the slowest pace of the past two weeks. Total volume in both the NYSE and Nasdaq declined 22% below the previous day's levels. Since yesterday was a consolidation day, it's bullish that significantly lower volume accompanied the nearly unchanged prices. This tells us the market was simply taking a breather following last week's solid gains. Conversely, higher turnover would have been indicative of "churning," which occurs when institutions stealthily sell into strength after a rally.
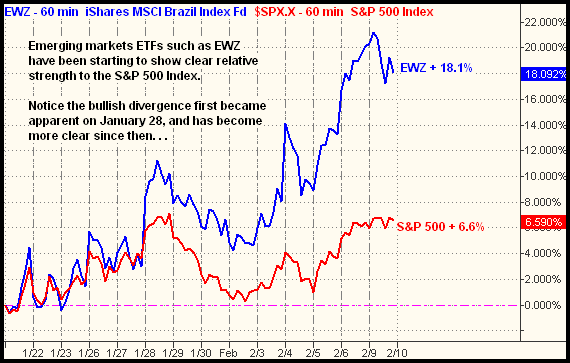
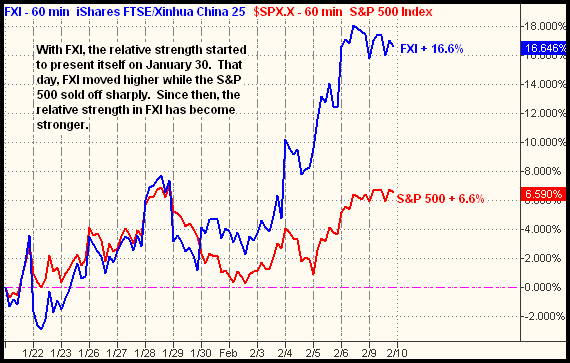
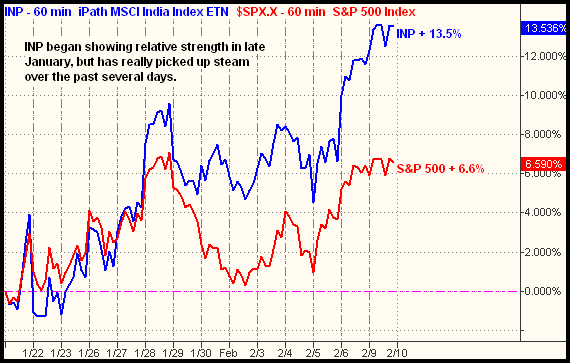
Over the past two weeks, a handful of international ETFs in emerging markets have shown substantial relative strength to the U.S. stock market indexes. On the "up" days, the gains of these ETFs have outperformed the percentage gains of the major indices. On "down" days, they have fallen less than the major indices, or sometimes not at all. Trading in specific sectors with this type of relative strength to the broad market is the whole basis of our strategy, and this is the first time in quite a while we've seen a group of ETFs with clear bullish divergence.
As detailed in my book, Trading ETFs: Gaining An Edge With Technical Analysis, my preferred method of spotting relative strength is through the use of "percentage change charts" that compare the performance of specific ETFs with benchmark indexes such as the S&P 500. Below are three such charts of an hourly time interval, each comparing the performance of an emerging market ETF with the S&P 500 Index. Plotting the performance of the past two weeks, when the S&P 500 formed support of its "swing low," the charts show how Brazil (EWZ), China (FXI), and India (INP) have been showing relative strength:


In each chart above, the blue line marks the percentage gain of the ETF, while the red line shows the performance of the S&P 500. Overall, notice how the divergent price patterns did not start to become readily apparent until the end of January, or first couple days of February. Over the past week, however, the relative strength has become much more obvious. Scanning the ETF charts on a daily basis enables you to spot divergent patterns as soon as they appear.
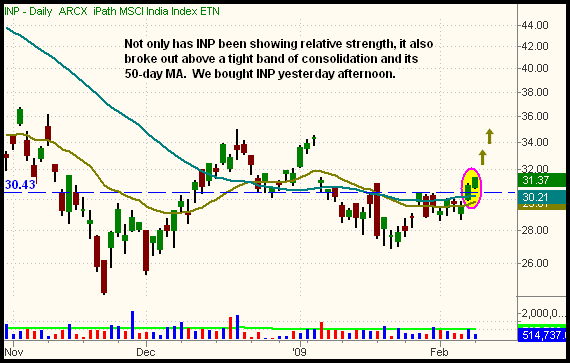
When spotting an ETF with relative strength on the "percentage change chart," it's important to also look at its daily chart pattern. When the daily chart indicates a breakout that coincides with relative strength, it often presents an ideal buy entry point. Yesterday, per Intraday Trade Alert to subscribers, we bought iPath India Index (INP) for that reason. On the daily chart of INP below, notice the breakout above consolidation and the 50-day moving average:

Yesterday, the S&P 500 gained just 0.1%, but INP gained 1.0%, confirming its relative strength. Had the S&P sustained a moderate loss yesterday, INP would likely have been flat to only marginally lower. That's the way it works with relative strength sector trading; ETFs with relative strength are the first to surge higher when the overall market moves higher, and the last to fall when the broad market goes down. Focusing your trading operations on ETFs with relative strength is a great way to maximize your profit potential, while simultaneously decreasing your capital risk.
Today, President Obama is expected to detail his plan to rescue banks, while the U.S. Senate is expected to vote on the new economic stimulus bill. Just like yesterday, we don't expect much action in the market until those events occur. The big question on everyone's mind, of course, is how the market will react to the Senate vote, regardless of whether or not the bill passes. Obviously, we have no way of knowing how much of the market's recent gains is already built into expectation of the bill's passage, so we won't solicit a guess as to how the market may react. Rather, we will let technical analysis guide us, while focusing on trading what we see, not what we think.
Open ETF positions:
Long - DGP, GDX, IBB, UGA, INP
Short - (none)
Deron Wagner is the Founder and Head Trader of both Morpheus Capital LP, a U.S. hedge fund, and Morpheus Trading Group, a trader education firm launched in 2001 that provides daily technical analysis of the leading ETFs and stocks. For a free trial to the full version of The Wagner Daily or to learn about Wagner's other services, visit MorpheusTrading.com or send an e-mail to deron@morpheustrading.com.
|