| The Wagner Daily ETF Report For January 27 |
| By Deron Wagner |
Published
01/27/2009
|
Stocks
|
Unrated
|
|
|
|
The Wagner Daily ETF Report For January 27
Stocks ripped higher out of the starting gate, with major indices up more than 2% in the first hour of trading. The morning rally was backed by very strong internals and higher volume on the NYSE, as such we felt the odds favored a bullish follow through to the upside later in the session. So what went wrong? Relative weakness in financials weighed heavily on the market, as an early afternoon selloff wiped out the morning gains, and pushed the major averages temporarily into negative territory heading into the 2:30 reversal period. But right on cue, indices rallied off the lows of the session in the final 90-minutes of trading to post moderate gains. The small-cap Russell 2000 led with a 1.2% gain. The Nasdaq Composite closed up 0.8%, while the S&P Midcap 400 and S&P 500 both gained 0.6%. The Dow Jones Industrials finished up 0.5%.
Turnover was once again lighter, with NYSE volume down 13% and Nasdaq volume lower by 15%. The quiet volume is in line with the price action, as the market continues to chop around, with no followthrough in either direction over the past two weeks. Market internals were strong early, but finished well off the best levels of the day by the close.
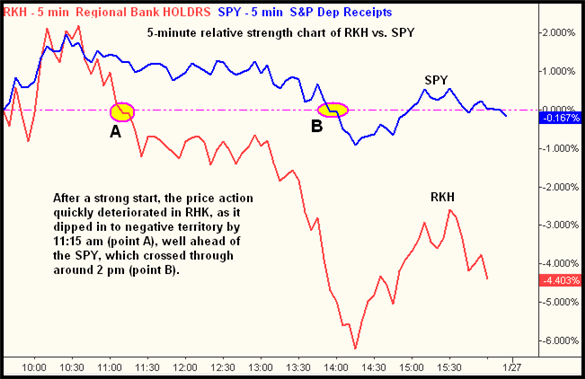
At 10:30 am yesterday, we were looking at the S&P 500 and Nasdaq Composite both up 2.5%, along with the banking sector ETF (RKH) up 4%. Advancing minus declining issues on the NYSE peaked above 2,000, while advancing volume led declining volume by a very bullish 7 to 1 margin. Total volume on the NYSE was slightly higher as well, so we were looking at a strong open in the market with solid confirmation. We briefly touched on what went wrong in the opening paragraph, so here is a 5-minute relative strength chart comparing the percentage performance between the HOLDRS Regional Bank ETF (RKH) and SPDRs S&P 500 Trust (SPY).

The percent gains are measured from Monday's open. The relative weakness is easy to spot on a line chart, as RKH quickly moved into negative territory three hours ahead of the SPY. While the late afternoon rally in the S&P allowed the index to close positive, the banking index ($BIX) dropped 4%. Looking at the components of RKH, we see that while JPM has bounced higher, BAC, WFC, and USB remain glued to the lows and refuse to budge.
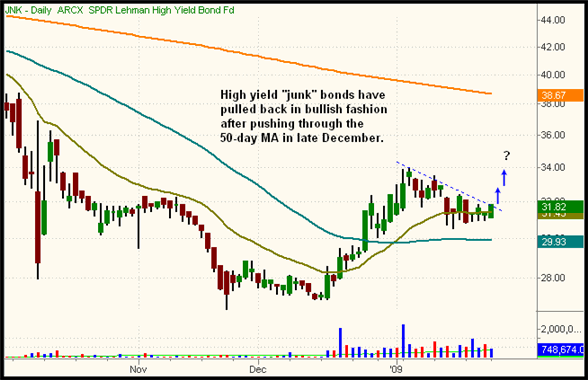
While the market continues to frustrate with wild intraday swings that fail to follow through, we have been laying low and scanning for ETFs that have a low correlation to broad market indices, such as the Lehman/Barclay's High Yield Bond ETF (JNK). JNK has recently caught our attention with a tight-ranged pullback to support of the 20-day EMA. This is the first rally off the lows to reclaim the 50-day MA, which looks buyable for an intermediate swing trade above the hourly downtrend line at 32.10, with a target at the 200-day MA (around 37.00-38.00). JNK is not an official setup, just a heads up to those looking for alternative ideas in this market.

So the two-day rally attempt in the market is still alive thanks to yesterday's timely 2:30 reversal. When we locate a fairly strong rally attempt off the lows using an hourly chart, we prefer to see the first pullback hold the 50% Fibo retracement level, with an absolute line in the sand at the 61.8% Fibo level. Strong moves should not correct more than 62% of the last wave up to show true impulsive behavior. While these rules are not absolute, they do give us a guideline for stop placement, as well as measuring trend strength. The S&P 500 hourly chart below held support at the 50% level, and closed back above the hourly 20-EMA. A break of the 61.8% Fibo level (823.00) should lead to another test of the lows. Though the market may have a tough time going anywhere ahead of Wednesday's Fed meeting.

Open ETF positions:
Long - DGP, GDX
Short - (none)
Deron Wagner is the Founder and Head Trader of both Morpheus Capital LP, a U.S. hedge fund, and Morpheus Trading Group, a trader education firm launched in 2001 that provides daily technical analysis of the leading ETFs and stocks. For a free trial to the full version of The Wagner Daily or to learn about Wagner's other services, visit MorpheusTrading.com or send an e-mail to deron@morpheustrading.com.
|