| The Wagner Daily ETF Report For January 26 |
| By Deron Wagner |
Published
01/25/2009
|
Stocks
|
Unrated
|
|
|
|
The Wagner Daily ETF Report For January 26
Fighting off a significantly lower open, broad market indices held the opening range lows, and ripped higher through much of the session to close in positive territory. Some late afternoon selling forced the averages to close off the highs of the session, but overall the reversal action was positive. The S&P Midcap 400 led Friday's reversal with a 1% gain, with the Nasdaq Composite not far behind at 0.8%. The S&P 500 and small-cap Russell 2000 added 0.5% and 0.3% respectively. The Dow Jones Industrials was the only average to close negative (down just 0.6%), however, the Dow finished in the top third of the day's range, forming a bullish reversal candle.
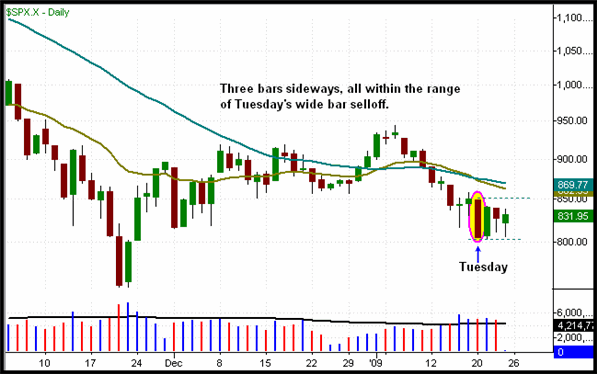
Total volume dropped 9% off the prior day's pace on the NYSE and 7% on the Nasdaq. While Friday's reversal off the lows showed some promise, the light volume rally failed to make any headway on the daily charts, as the major averages are still trading in a very tight range (see chart of S&P 500 below):

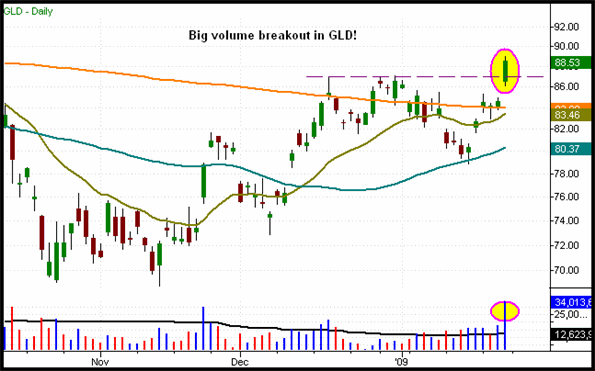
Last week we discussed the bullish technical action in metals, as SPDR Gold Trust (GLD) and iShares Silver Trust (SLV) were both setting up to break out above the highs of the current range, thereby confirming the break of a six month downtrend line. Friday's action was the bullish confirmation we were looking for, as both GLD and SLV gained nearly 5% on a big volume breakaway gap up. Feeding off the strength in spot gold, our two long positions Gold Double Long (DGP) and Market Vectors Gold Miners (GDX) closed up 10% and 8% respectively.

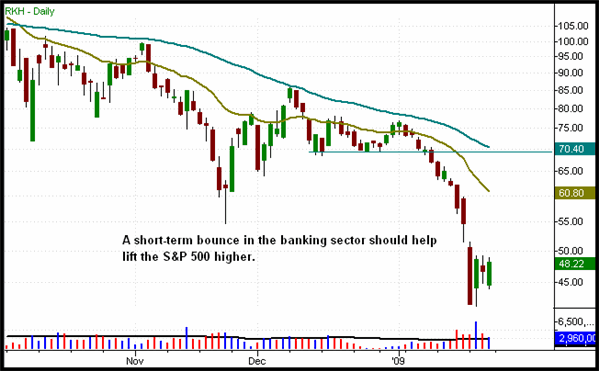
The financial sector has weighed down the S&P 500 over the past few weeks, led by the sharp selloff in the banking index. The ugly chart of the HOLDRS Regional Bank ETF (RKH) below has lost momentum to the downside, and looks ready for a short-term bounce from oversold conditions. If so, that would certainly give a nice boost to the S&P 500. We are not monitoring RKH for a long or short entry, just following the action closely for clues on broad market direction.

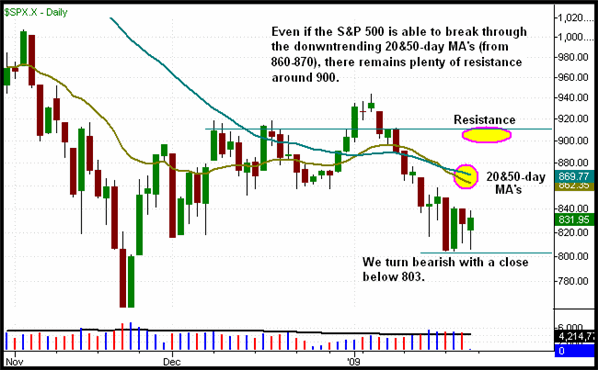
Though the tight-ranged action in the broad market tells us to prepare for a move out in either direction, we are leaning towards a move to the upside. Given the lack of leadership in the market and overhead resistance, we do not expect too much from any broad market rally. Looking at the chart of the S&P 500 below we see resistance from the 20 & 50-day moving averages, as well as the prior highs in December around 900. While we could see the S&P push through the moving averages, we are doubtful that there is enough buying power to penetrate through 900. A close beneath the lows of the range (below 803) should lead to new lows.

Open ETF positions:
Long - DGP, GDX
Short - (none)
Deron Wagner is the Founder and Head Trader of both Morpheus Capital LP, a U.S. hedge fund, and Morpheus Trading Group, a trader education firm launched in 2001 that provides daily technical analysis of the leading ETFs and stocks. For a free trial to the full version of The Wagner Daily or to learn about Wagner's other services, visit MorpheusTrading.com or send an e-mail to deron@morpheustrading.com.
|