|
The Wagner Daily ETF Report For January 9
Stocks got off to a lower start, indecisively chopped around throughout most of the day, then grinded their way higher to finish with mixed results. The S&P 500 eked out a gain of 0.3%, while the Dow Jones Industrial Average finished lower by the same percentage. The Nasdaq Composite showed relative strength again, enabling the index to advance 1.1%. The small-cap Russell 2000 and S&P Midcap 400 indices rose 1.0% and 0.8% respectively. Both the S&P 500 and Nasdaq Composite closed at their best levels of the day, but the laggard Dow Jones Industrials settled at the upper quarter of its intraday range.
Total volume in the both the NYSE and Nasdaq receded 3% below the previous day's levels, preventing the S&P 500 and Nasdaq from registering a bullish "accumulation day." However, upon intraday analysis of the market's volume, we noted turnover picked up when stocks began rallying in the final hours of trading. At mid-day, trading was on pace to be significantly lighter than it finished. In the NYSE, advancing volume exceeded declining volume by approximately 2 to 1. The Nasdaq adv/dec volume ratio was positive by 5 to 2.
Yesterday morning, we got our entry into Claymore Global Solar Energy (TAN), which we've been monitoring for a pullback over the past week. Recall from our recent analysis that we were waiting for a retracement to support of the 50-day moving average, which had converged with the 20-day exponential moving average as well. Since yesterday's opening gap down put TAN within a few cents of those major support levels, we sent an Intraday Trade Alert to subscribers of The Wagner Daily, informing them we were buying it. On the daily chart below, we've circled the pullback to support:
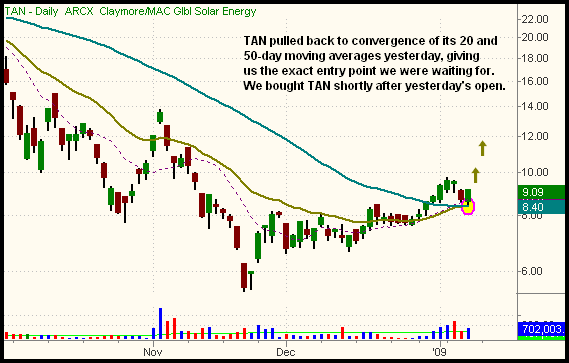
Though it was tempting to buy TAN when upside momentum started kicking in at the end of last week, we've learned this market is not strong enough to chase ETFs not bought at the original breakout level. Rather, it's crucial to have a high degree of patience to wait for the setups to come to you, just as we also did with CurrencyShares Japanese Yen (FXY) this week. With the TAN setup, buying on yesterday's gap down to support did not require a lot of thought because we had already identified the ETF as having a lot of relative strength after it broke out above resistance. Having the patience and discipline to wait for the proper entry point enabled the trade to immediately show a profit after buying it. On the upside, our approximate target is a test of the November 4 highs, at which point we plan to sell into strength. Our protective stop is below the lows of the late December consolidation.
Although overall market momentum still appears to favor the bulls, traders looking for an ETF short setup with relative weakness might consider the Regional Bank HOLDR (RKH). Its daily chart is shown below:
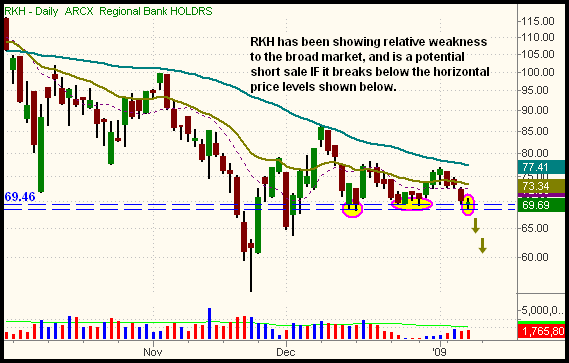
When the S&P 500, Nasdaq Composite, and Dow Jones Industrial Average all recently moved back above their 50-day moving averages, RKH barely moved higher. Then, as the major indices began pulling back, RKH quickly fell back to the lows of its recent consolidation. This relative weakness in RKH tells us it should become a downside leader IF the current correction in the broad market continues lower. But even if the major indices find support at their 50-day MAs and start moving back up, RKH should lag the gains of the major indices. All this makes RKH an ideal hedge to reduce risk against long positions in your portfolio.
As illustrated on the chart above, the first short entry for RKH is a breakdown below the recent closing low of $69.46, set on December 15. But since that day's intraday low is nearly a point lower ($68.50), minor support may be found at that price. As such, you might consider selling short only half of your intended position size on a break below $69.46, then adding the remaining shares after confirmation from the break below $68.50. In either case, we advise against "jumping the gun" and selling short before either of those support levels are broken. As for an initial protective stop, consider going at least fifty cents above the 20-day EMA, presently at $73.34.
Yesterday's low in the S&P 500 coincided with short-term support of the 20-day exponential moving average, and was within just one percent of the 50-day moving average we've been discussing. With most of the major indices showing strength into the close and finishing at their intraday highs, the broad market is now positioned to resume its intermediate-term uptrend off the November lows. The next important test of resistance will be the January 6 "swing highs." If/when the major indices move back to their recent highs, we'll re-assess overall market action to determine the likelihood of stocks making another leg up.
Open ETF positions:
Long - FXY, FXI, USO, TAN, GDX, SLV
Short - (none)
Deron Wagner is the Founder and Head Trader of both Morpheus Capital LP, a U.S. hedge fund, and Morpheus Trading Group, a trader education firm launched in 2001 that provides daily technical analysis of the leading ETFs and stocks. For a free trial to the full version of The Wagner Daily or to learn about Wagner's other services, visit MorpheusTrading.com or send an e-mail to deron@morpheustrading.com.
|


 Free Festival of Traders Videos