|
The Wagner Daily ETF Report For December 9
Buying pressure from last week's three separate days of higher volume gains triggered a broad-based rally that enabled the major indices to break out above key resistance levels yesterday. Posting similar gains to last Friday's session, the Nasdaq Composite advanced 4.1%, the S&P 500 3.8%, and the Dow Jones Industrial Average 3.5%. The small-cap Russell 2000 climbed 4.5%, as the S&P Midcap 400 closed 3.8% higher. Because the main stock market indexes opened several percent higher, a majority of yesterday's gains were the result of the opening gap up, not intraday strength. After trading sideways throughout most of the day, stocks briefly moved to new session highs in the final hour of trading, but drifted back down to their prior intraday levels. The major indices thereafter closed in the upper quarter of their intraday ranges, just off their best levels of the day.
Turnover rose across the board, enabling the S&P 500 and Nasdaq Composite to secure another "accumulation day," the fourth such occurrence of institutional buying this month. Total volume in the NYSE increased 7% over the previous day's level, while volume in the Nasdaq rose 4%. In downtrending markets, the presence of more than three "accumulation days" within a period of several weeks often creates enough positive sentiment to spark a significant trend reversal. In yesterday's newsletter, we said, "Volume is also a leading, not a lagging, indicator of price action." The breakout that followed last week's bullish price to volume relationship in the overall market was a perfect example of this. Nevertheless, one concern is that volume in both exchanges remained below 50-day average levels. November 21, more than two weeks ago, was the last time trading exceeded average levels.
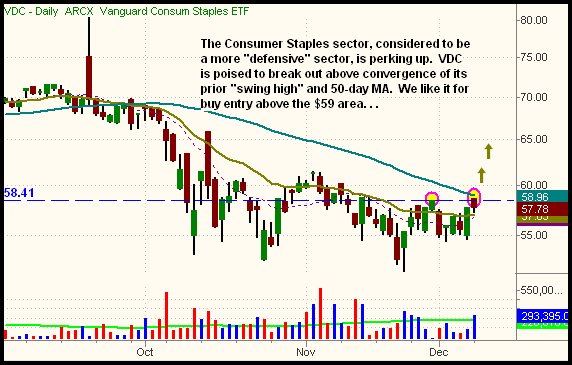
Vanguard Consumer Staples (VDC) is setting up for a potential short to intermediate-term buy. The high of its recent consolidation converges with resistance of its 50-day MA. A rally above that convergence would be our trigger point for buy entry, as ETFs above their 50-day moving averages present the best chances for upside follow-through on a swing trade. Below is the daily chart of VDC:

Another industry sector ETF that moved above its 50-day MA yesterday was Pharmaceutical HOLDR (PPH). However, PPH still has a lot of overhead supply from the past two months to contend with. As such, we're not that impressed with the PPH setup at this point, but it's been added to our potential buy watchlist. Quite a few other sector ETFs are within striking distance of their 50-day MAs as well, and we'll be monitoring their price action and reporting the best standouts in the coming days.
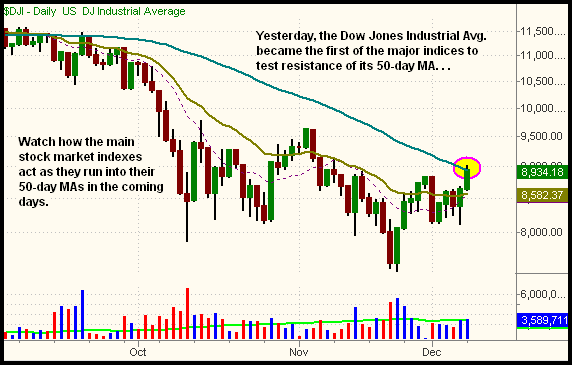
Yesterday, all the main stock market indexes broke out above resistance of their intermediate-term downtrend lines that had been intact for the past several months. The bullish move also enabled the indices to set "higher highs" on their daily charts. Since last Friday's bullish price action set up the market for an upside move yesterday, it's encouraging to see more orderly moves in the market that are actually following through. However, the real determinant to the market's direction throughout the rest of this month will be the price reaction of the main stock market indexes as they test pivotal resistance of their 50-day moving averages (MA). Because mutual funds, hedge funds, and other institutions view the 50-day moving average as a dominant indicator of intermediate-term trend, the 50-day MA typically acts as a major level of resistance in downtrends, and an equally significant level of support in uptrends. Yesterday, the Dow became the first of the major indices to run into its 50-day MA:

The Dow is the only main stock market index that has already rallied into resistance of its 50-day MA, but the S&P 500 and Nasdaq Composite are likely to do the same in the coming days. You may want to set price alarms on your trading software, so you are quickly alerted when the other indexes run into their 50-day MAs as well. For the S&P 500, the 50-day MA is at 930, about 2.1% above yesterday's closing price. The 50-day MA of the Nasdaq Composite is at 1,640, 4.3% above its current price.
Even if the major indices overcome resistance of their 50-day moving averages, it definitely does not mean the bear market is over. However, such a technical breakout would tip the odds in favor of the bulls in the short to intermediate-term. Just as strong markets don't go straight up forever without eventually having a significant pullback, the inverse is true of weak markets. Therefore, a counter-trend bear market bounce that lasts the next 1 to 3 months is certainly not out of the question. When stocks start to exhibit signs of institutional distribution again (higher volume losses), that will be our first clue to be extra careful on the long side, and to start considering the short side of the market again. But until then, we'll selectively buy ETFs with relative strength and/or bullish chart patterns, as we focus on trading what we see, not what we think.
Open ETF positions:
Long - FXI, USO (short-term, overnight trade only)
Short -
Deron Wagner is the Founder and Head Trader of both Morpheus Capital LP, a U.S. hedge fund, and Morpheus Trading Group, a trader education firm launched in 2001 that provides daily technical analysis of the leading ETFs and stocks. For a free trial to the full version of The Wagner Daily or to learn about Wagner's other services, visit MorpheusTrading.com or send an e-mail to deron@morpheustrading.com.
|