|
The Wagner Daily ETF Report For December 5
After two days of strong gains on higher volume, stocks took a breather yesterday. The major indices initially consolidated in a sideways range throughout most of the session, but this time the bears took control in the final ninety minutes of trading, causing stocks to close substantially lower. The Dow Jones Industrial Average declined 2.5%, the S&P 500 2.9%, and the Nasdaq Composite 3.1%. The small-cap Russell 2000 fell 3.1%, as the S&P Midcap 400 lost 3.5%. A bounce in the final minutes of trading prevented stocks from finishing at their worst levels of the day. Each of the main stock market indexes closed in the bottom third of its intraday range.
Lighter turnover matched yesterday's losses, enabling stocks to avert a "distribution day." Total volume in both the NYSE and Nasdaq declined 10% below the previous day's levels. Although the major indices registered significant losses, the lighter trading tells us institutions were not aggressively leaning on the sell button. This week, there have been two days of broad market gains, and two days of losses. Both of the "up" days occurred on increasing volume, and both of the "down" days occurred on lighter volume. Despite a net overall price decline in the broad market this month, this is exactly the type of volume patterns a healthy market should exhibit "under the hood."
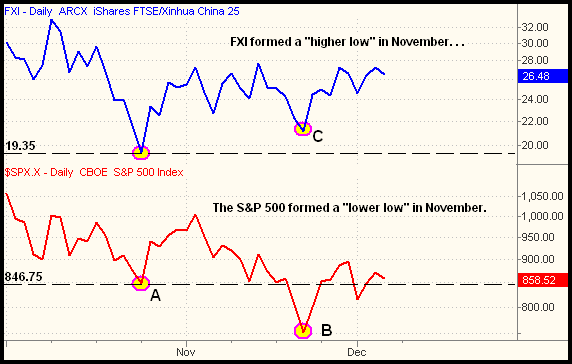
As one of the ETFs we're currently monitoring for potential buy entry, iShares Xinhua China 25 (FXI) has been showing relative strength to the broad market for the past several months, and is now poised to breakout above recent consolidation and its 50-day moving average. The line chart below illustrates FXI's relative strength to the S&P 500 since the beginning of October 2008:

The S&P 500 (the red line) clearly set a "lower low" last month (B) when it fell below support of its prior low from October 2008 (A). But when the S&P 500 set its "lower low," notice FXI actually set a "higher low" (C), thereby clearly indicating relative strength. ETFs with relative strength will typically outperform the market on the "up" days, while losing less than the broad market on the "down" days.
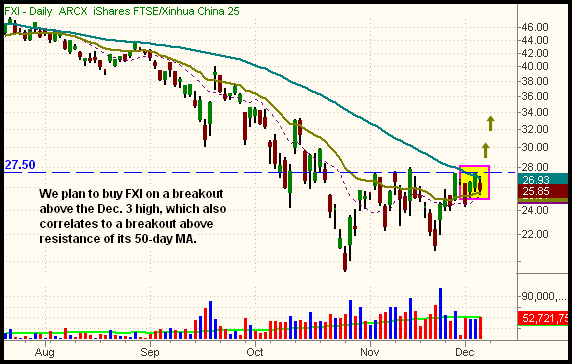
Since forming its "higher low," FXI has been consolidating in a tight, sideways range for the past week. We expect it to soon breakout to form a "higher high," which would confirm an intermediate-term trend reversal. The daily chart of FXI below more clearly illustrates the buy setup:

Our buy entry into FXI will be a rally above the December 3 high (highlighted with the pink rectangle), which should also confirm the breakout above the 50-day MA. Ideal stop placement is below the December 1 low of 24.41, plus the usual "wiggle room" to allow for a probe below support. Regular subscribers to The Wagner Daily should note our detailed trigger, stop, and target prices for the FXI setup below.
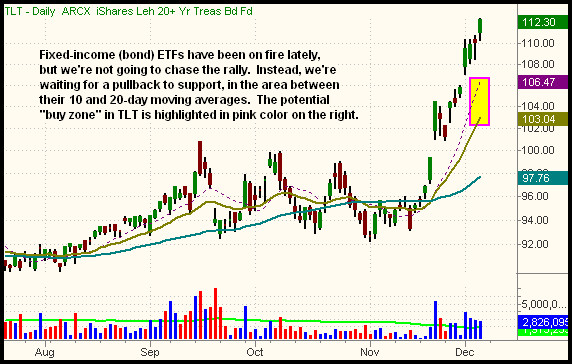
We have been monitoring the various fixed-income (bond) ETFs for a pullback to support. They've been on fire, on a parabolic run, but they will eventually correct. When they do, the retracement should offer a low-risk entry point on the buy side. In particular, we're monitoring iShares 20+ year T-Bond (TLT), which would be buyable on a pullback to the range between its 10 and 20-day moving averages. In addition to any capital gains realized from trading TLT, remember it also pays substantial dividends on a mostly monthly basis. Our potential "buy zone" is circled on the daily chart of TLT below:

Yesterday, we illustrated how the hourly chart interval can be useful for plotting trendlines in the broad market when the daily charts are too choppy. Although the late-day sell-off caused the major indices to break support of their hourly uptrend lines from the November 21 lows, the main stock market indexes still closed above support of their prior day's lows. If, and that's a big "if," the stock market is trying to form a significant bottom, we cannot expect it to happen as a singular event; rather, bear market bottoms are typically a process. As such, we must expect gyrations and "shakeouts," even in the midst of positive overall price action and volume patterns. Yesterday's losses occurred on lighter volume, leading stocks held up pretty well, and no major technical damage was done to the charts. As such, odds are good that yesterday's pullback was just an insignificant pullback to cause the "weak hands" to sell their holdings on the first sign of a correction. If the major indices finish below their lows of the past several days in today's session, all bets are off on the long side of the market. But unless that happens, the bulls still appear to have the overall upper hand in the short-term.
Open ETF positions:
Long - MVV, XLU
Short - (none)
Deron Wagner is the Founder and Head Trader of both Morpheus Capital LP, a U.S. hedge fund, and Morpheus Trading Group, a trader education firm launched in 2001 that provides daily technical analysis of the leading ETFs and stocks. For a free trial to the full version of The Wagner Daily or to learn about Wagner's other services, visit MorpheusTrading.com or send an e-mail to deron@morpheustrading.com.
|