|
The Wagner Daily ETF Report For December 2
Resistance of the primary downtrend lines we illustrated in Monday morning's market analysis "did its thing" yesterday, causing the main stock market indexes to surrender about half of their gains from the five-day winning streak. After opening several percent lower, the major indices descended further throughout the morning session, stabilized, then briefly attempted to rally after coming into support of their 10-day moving averages. However, a high volume wave of selling in the final hour caused stocks to plummet to new lows of the day and finish deep in the red. The Dow Jones Industrial Average tumbled 7.7%, the S&P 500 8.9%, and the Nasdaq Composite 9.0%. Small and mid-cap stocks, which showed the most relative strength throughout last week's rally, fell the hardest. The Russell 2000 and S&P Midcap 400 indices nosedived 11.9% and 10.9% respectively. All the major indices closed at their dead lows of the day.
As was to be expected, turnover was much higher than the lethargic levels of last Friday's holiday-shortened session. Total volume in the NYSE rose 107, while volume in the Nasdaq increased 147% over the previous day's level. Though the losses on higher volume caused both the S&P 500 and Nasdaq Composite to register a "distribution day," it's notable that volume in both exchanges remained well below 50-day average levels. Greater than average volume would have indicated mutual funds, hedge funds, and other institutions were rushing to the exit doors en masse, but the relatively moderate turnover was more indicative of profit taking from last week's gains. Still, market internals were extremely ugly. Declining volume in the NYSE annihilated advancing volume by a whopping margin of 75 to 1, and declining stocks led advancers by more than 7 to 1. The Nasdaq adv/dec volume ratio was negative by 35 to 1.
In yesterday's Wagner Daily, we said, "Kicking off the month of December at such clear levels of resistance, the major indices have a good chance of at least entering into a short-term pullback over the next several days." The combination of light volume throughout last week's rally and resistance of the primary downtrend lines on the daily charts was the basis for that assessment. As such, we were not shocked that stocks sold off yesterday. However, we were admittedly a bit surprised that new support of the 10-day moving averages and prior lows from October 2008 failed to generate buying interest.
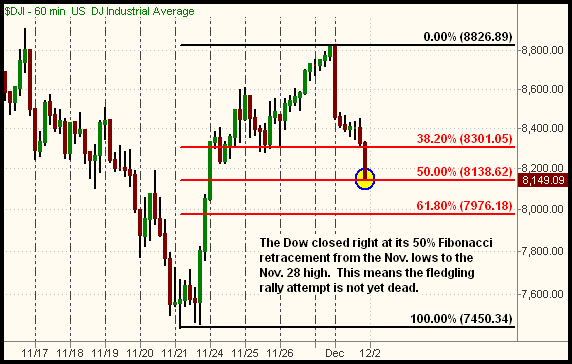
On the surface, one might automatically assume yesterday's huge percentage losses killed the stock market's fledgling rally attempt. But it's important to keep the losses in perspective with last week's gains. From November 21 - 28, for example, the Dow Jones Industrial Average scored an enormous gain of 17%. Therefore, yesterday's loss of 7.7% was equivalent to just a 50% retracement. To illustrate this, we've applied Fibonacci retracement lines on the hourly chart of the Dow below (moving averages removed so you can more easily see the Fibonacci lines):

As long as the major indices hold above their 61.8% Fibonacci retracement levels, the broad market still has a good chance of rallying back to test last week's highs in the near-term. Conversely, any firm closing prices below the 61.8% retracement levels will tip the odds in favor of the main stock market indexes first re-testing last month's lows.
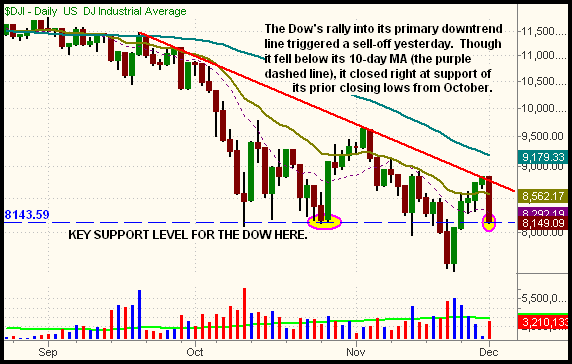
Looking at the Dow's daily chart, it's discouraging the index failed to hold support of its 10-day moving average, but it's positive that the index is still holding at horizontal price support from the October lows. This is illustrated on the daily chart below:

Going into yesterday's session, resistance of the Dow's daily downtrend line (the red descending line) meant there was a decent short setup in the Dow (or through buying the inversely correlated UltraShort Dow ProShares [DXD]). However, because the index gapped down to open sharply lower, support of the 10-day moving average significantly decreased the reward-risk ratio of selling short yesterday. If selling short, we would have been inclined to just make it an intraday trade anyway. Instead, we opted to stick to our original plan, which was to "wait for the main stock market indexes to retrace some of their recent gains and touch key support levels, then buy a few ETFs with relative strength."
Fortunately, we largely stayed out of harm's way by avoiding new long entries in the broad-based ETFs when they pulled back. In the afternoon, the S&P 500 retraced to support of both its 10-day moving average and prior lows from October, creating a good reward-risk ratio for buy entry, but we wanted to wait for confirmation of a bullish intraday reversal before trying to pick a bottom. Obviously, that reversal never came, which caused us to pass on buying any of the broad-based ETFs.
Although we stayed out of the broad market, we took advantage of recent relative strength in the Utilities sector by buying S&P Select Utilities SPDR (XLU) when it pulled back to support of its 50-day moving average, but heavy late-day selling in the broad market caused XLU to break support as well. The good news is that our long position in CurrencyShares Japanese Yen (FXY) acted as a bearish hedge, as FXY gained nearly 3 points yesterday. Our only other position is Gold Double Long (DGP), which broke below the formation of its "bull flag" pattern, but is still above our trailing stop. With our stop now above our original entry price, risk has largely been removed from the DGP trade.
Over the next few days, we'll be keeping a close eye on whether or not the major indices manage to hold above their 61.8% retracement levels from their November lows. If they do, we'll consider a new long position in the broad market, but only after the major indices confirm a resumption of their short-term uptrends by moving back above their 10-day moving averages and/or 20-period exponential moving averages on the hourly charts. On the other hand, we'll also consider new short entries for swing trading if the 61.8% retracement levels are violated. As always, we'll promptly send an Intraday Trade Alert to subscribers if we enter any new trades. Otherwise, we'll just sit back and focus on managing our existing three positions.
Open ETF positions:
Long - FXY, DGP, XLU
Short - (none)
Deron Wagner is the Founder and Head Trader of both Morpheus Capital LP, a U.S. hedge fund, and Morpheus Trading Group, a trader education firm launched in 2001 that provides daily technical analysis of the leading ETFs and stocks. For a free trial to the full version of The Wagner Daily or to learn about Wagner's other services, visit MorpheusTrading.com or send an e-mail to deron@morpheustrading.com.
|