|
The Wagner Daily ETF Report For December 1
Stocks wrapped up the volatile month of November on a positive note, as the S&P 500 logged its fifth consecutive day of gains in last Friday's holiday-shortened session. The S&P 500 climbed 1.0% and the Dow Jones Industrial Average advanced 1.2%, but the Nasdaq Composite showed relative weakness by gaining only 0.2%. Small and mid-cap stocks continued to show leadership off their recent lows. The Russell 2000 and S&P Midcap 400 indices rallied 0.9% and 1.0% respectively. All the main stock market indexes finished at their best levels of the day and week, but still logged substantial monthly declines. In November, the Nasdaq Composite fell 10.8%, the S&P 500 7.5%, and the Dow Jones Industrial Average 5.3%. It was the third straight month of large losses in the broad market.
As anticipated, turnover was minimal in last Friday's session that closed three hours early. Total volume in the NYSE receded 38%, while volume in the Nasdaq decreased 58% below the previous day's level. Even without the early closing time, trading still would have been on pace to be well below average levels. Though the broad market has registered gains for five straight sessions, only one of those "up" days has occurred on higher volume. This tells us last week's rally was not predicated on buying by mutual funds, hedge funds, and other institutions; rather, the gains were due to a lack of sellers. When rallies occur on declining turnover, it only takes one session of higher volume gains to undo several days of gains. Nevertheless, we won't really know the intent of institutional participation until this week, as volume typically declines during Thanksgiving week regardless. On the plus side, the stock market still scored two "9 to 1" up days last week, meaning advancing volume has been much greater than declining volume. This was discussed more thoroughly in last Friday's newsletter.
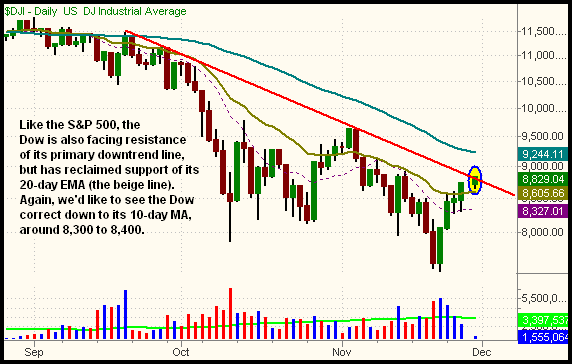
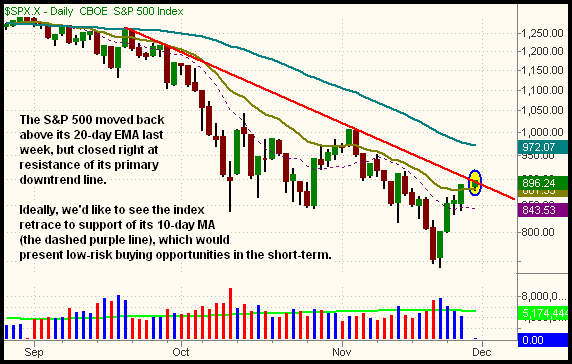
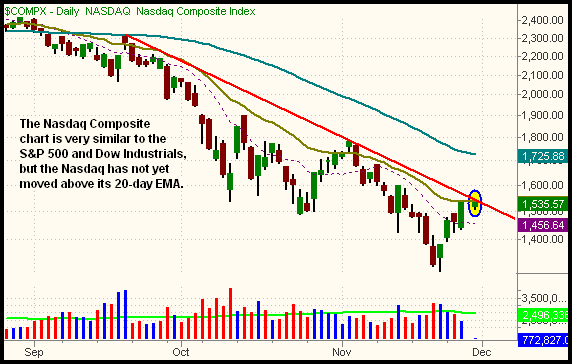
Despite the lighter volume, which certainly warrants caution, last week's tone was rather bullish for a change. All the major indices moved back above resistance of their prior lows from October 2008. Further, all the main stock market indexes except the Nasdaq closed the week above their 20-day exponential moving averages (EMAs), pointing to a potentially bullish change of intermediate-term bias if they manage to hold above their 20-day EMAs for more than a day or two. Nevertheless, the Dow Jones Industrial Average, S&P 500, and Nasdaq Composite all closed right at the area of resistance of their respective primary downtrend lines. The three daily charts below illustrate this:


Kicking off the month of December at such clear levels of resistance, the major indices have a good chance of at least entering into a short-term pullback over the next several days. Ideally, we'd like to see the main stock market indexes retrace down to support of their 10-day moving averages (the purple dashed lines on the charts above). Notice that such a correction would also put the major indices back at key support of their prior lows from October 2008. Because the recent rally off the November lows was so sharp, such a pullback would actually be healthy; it would not even represent a violation of the 38.2% Fibonacci retracement levels from the November 21 lows to November 28 highs.
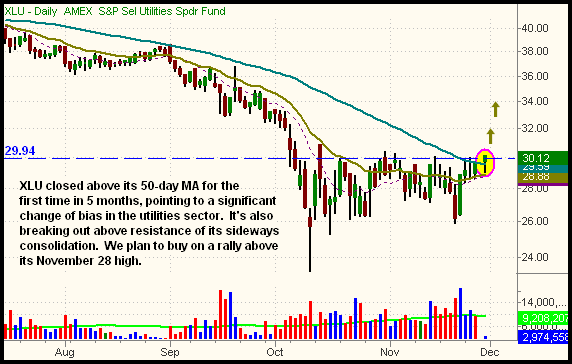
The utilities sector has been showing early relative strength to the broad market, as the Dow Jones Utilities Average ($DJU) was one of the first industry sector indexes to move back above its 50-day moving average. As such, we expect the sector to show bullish divergence to the broad market this week. To confirm this, watch to see how the sector acts when the broad market pulls back. If relative strength remains, the index should correct by a lesser percentage than the major indices, and should also outpace the gains of the broad market on any days of gains. Below, notice how S&P Select Utilities SPDR (XLU) closed the week above its 50-day MA (for the first time in five months), and is also about to break out above the high of two months of sideways consolidation:

Our basic short-term plan in the coming week is to wait for the main stock market indexes to retrace some of their recent gains and touch key support levels, then buy a few ETFs with relative strength. XLU is one such ETF, especially if new support of its 50-day MA holds up. Overall, we think there's a good chance stocks move higher throughout the rest of the year, which would be confirmed if the major indices breakout above resistance of their downtrend lines shown on the charts above. Assuming they manage to do so, the next stop would be resistance of their prior highs from November 4, which roughly correlates to resistance of their 50-day moving averages as well. Such a tradeable, counter-trend bounce is realistic in the intermediate-term, but it's way too early to declare a definitive bottom to the current long-term bear market. Conversely, we'd be more inclined to initiate new short positions as the main stock market indexes approach their November 4 highs and 50-day moving averages.
Open ETF positions:
Long - DGP, FXY
Short - (none)
Deron Wagner is the Founder and Head Trader of both Morpheus Capital LP, a U.S. hedge fund, and Morpheus Trading Group, a trader education firm launched in 2001 that provides daily technical analysis of the leading ETFs and stocks. For a free trial to the full version of The Wagner Daily or to learn about Wagner's other services, visit MorpheusTrading.com or send an e-mail to deron@morpheustrading.com.
|