|
The Wagner Daily ETF Report For November 28
Traders approached the Thanksgiving holiday in an upbeat mood on Wednesday, enabling the benchmark S&P 500 Index to bag its fourth straight session of gains. Stocks initially opened slightly lower, but the bulls immediately reversed the morning weakness, sending the major indices into steady uptrends that lasted throughout the entire day. The Nasdaq Composite climbed 4.6%, the S&P 500 3.5%, and the Dow Jones Industrial Average 2.9%. The small-cap Russell 2000 and S&P Midcap 400 jumped 5.8% and 5.3% respectively. For the third time within the past four sessions, all the main stock market indexes closed at or near their intraday highs.
Once again, light volume was the main disappointment of Wednesday's otherwise bullish session. In both the NYSE and Nasdaq, total volume eased 15% below the previous day's levels. Though the main stock market indexes have logged impressive gains over the past four days, all but one of those "up" days occurred on declining volume. Turnover in both exchanges has also limped in below 50-day average levels in each of the past three sessions. Unfortunately, this is opposite of the volume patterns typically seen when markets are trying to form a significant bottom. Nevertheless, market internals were extremely bullish. In the NYSE, advancing volume outpaced declining volume by a margin of 9 to 1. The Nasdaq adv/dec volume ratio was positive by nearly 15 to 1. This marked the second instance of a "9 to 1 up day" since the November 21 bottom. According to Martin Zweig, who developed the "9 to 1" indicator years ago, such a large imbalance of advancing volume over declining volume in the overall market "is a significant sign of positive momentum. In other words, when daily up volume leads down volume by a ratio of 9-to-1 or more, that tends to be an important signal for stocks" (from Zweig's book, Winning On Wall Street).
Even though most ETFs have rallied sharply off their lows over the past week, very few tradeable chart patterns have developed. If broad-based price consolidation and/or a pullback develops in the coming days, we'll soon begin seeing better chart patterns emerge, but we're simply not into chasing a parabolic bounce off the lows. Presently, two of the best ETF patterns we see are the charts of gold-related ETFs, one of which we're already holding. Market Vectors Gold Miners (GDX), which is composed of a basket of individual gold mining stocks, just broke out above the high of its tight consolidation of the past three days:
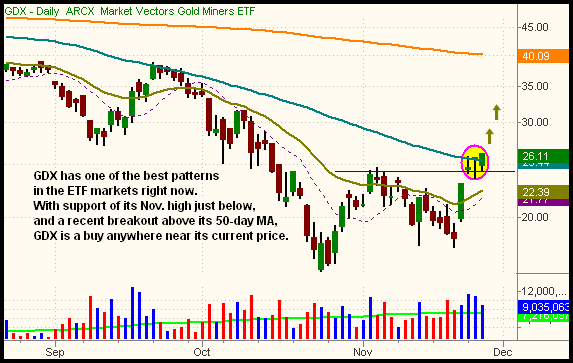
With GDX now above support of its 50-day MA, it can be bought on any small pullback. Ideally, the $25 - $25.50 area represents an ideal buy point because the prior high from November 5 (marked by the blue horizontal line) should now provide support as well. Since GDX closed just above the high of its short-term consolidation, it's not even too late to buy near its current price, but that is probably best handled as a daytrade.
A sibling of the gold mining ETF, SPDR Gold Trust (GLD) follows the price of the spot gold futures contract. Presently, it is forming a "bull flag" pattern after breaking out above its 50-day MA. We have annotated the pattern on the daily chart of GLD below:
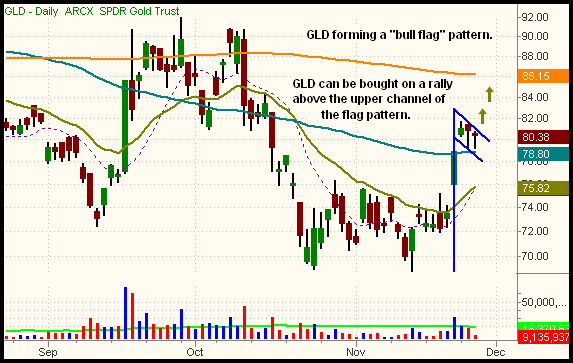
We're already positioned in Gold Double Long (DGP), which also follows the price of spot gold, but moves at a 2 to 1 ratio to the price of spot gold. At the moment, GDX is showing a bit of relative strength to GLD (and DGP) because it already closed above its November 24 and 25 highs, but GLD has not. Nevertheless, we like the "bull flag" pattern in spot gold. It's not a bad idea to have positions in both GDX and GLD, as the gold mining stocks and spot gold tend to oscillate back and forth in terms of which ETF shows the most relative strength on any given day.
On November 20, the S&P 500 briefly dipped below key support of its 2002 low, then reversed and surged higher the following day. Though the "undercut" was bullish, our initial concern was major overhead resistance and supply created from the prior lows of October 2008. But on Wednesday, the major indices zoomed back above their prior lows from October. The "undercut" at support of an 11-year low, the speedy reversal back above the prior lows, the two "9 to 1" days, and the stock market's ability to string together four straight winning days all point to a definite change in overall market sentiment from recent months.
While it's still too early to confidently call a long-term bottom, we now feel the market is setting up for a tradeable, intermediate-term bounce that could lend stocks a bullish bias at least through year-end. One caveat, however, is the light volume in the overall market over the past week. We'll have to see if the market retains most of its recent gains when volume picks up, most likely after the holiday weekend. Now that the major indices have moved back above their October lows, our plan is still to buy the first pullback to short-term support (such as the 20-EMA on the hourly chart or prior lows of October). We won't, however, be entering any new trades in today's shortened session, as volume is likely to be very minimal.
Open ETF positions:
Long - DGP, FXY, FXE
Short - (none)
Deron Wagner is the Founder and Head Trader of both Morpheus Capital LP, a U.S. hedge fund, and Morpheus Trading Group, a trader education firm launched in 2001 that provides daily technical analysis of the leading ETFs and stocks. For a free trial to the full version of The Wagner Daily or to learn about Wagner's other services, visit MorpheusTrading.com or send an e-mail to deron@morpheustrading.com.
|


 Free Festival of Traders Videos