|
The Wagner Daily ETF Report For November 21
Bearish momentum from Wednesday's breakdown to new multi-year lows led to another session of sharp losses across the board. After opening lower, the major indices briefly reversed into positive territory by mid-day, but the bears returned in the afternoon, sending all the main stock market indexes more than 5% lower. The Nasdaq Composite tumbled 5.1%, the Dow Jones Industrial Average 5.6%, and the S&P 500 6.7%. The small-cap Russell 2000 fell 6.6%, as the S&P Midcap 400 lost 7.8%. Like the previous day, all the major indices closed at their worst levels of the day, month, and past five years.
Turnover spiked higher in both exchanges, clearly signalling a rush to the exit doors on the part of mutual funds, hedge funds, and other institutions. Total volume in the NYSE zoomed 39% above the previous day's level, while volume in the Nasdaq similarly rose 34%. NYSE and Nasdaq volume soared to its highest daily levels in weeks. Market internals were obviously pretty ugly, but better than Wednesday's readings. Declining volume in the NYSE exceeded advancing volume by a margin of 14 to 1. The Nasdaq adv/dec volume ratio was negative by 10 to 1.
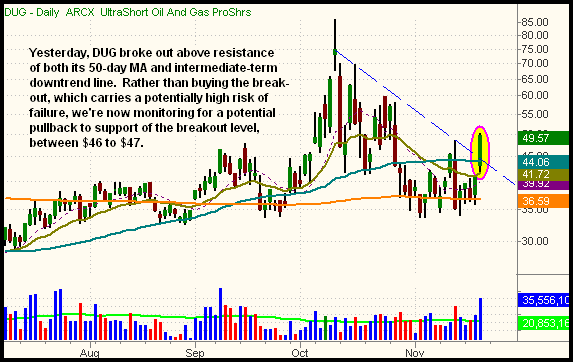
In yesterday's commentary, we said, "But now that the major indices have broken down to new lows, steadier, more tradeable trends may develop, albeit to the downside. . .tradeable setups on the short side may develop by waiting for the next bounces into resistance of the breakdown levels. In the case of the inversely correlated UltraShort ETFs, this would equate to waiting for a pullback to the breakout levels." After assessing the daily charts of the UltraShort family of ETFs, we came across two that we like for potential buy entry on a pullback. The first is UltraShort Oil and Gas ProShares (DUG), whose daily chart is shown below:

Designed to move in the opposite direction of the Oil and Gas sector, DUG broke out above resistance of its 50-day moving average yesterday (the teal line). DUG initially attempted to break out above its 50-day MA on November 12, but the stock market's rally on November 13 caused it to fall back down. DUG also rallied above its intermediate-term downtrend line from the October 10 high (the dashed blue line), which roughly converged with the 50-day MA. We didn't buy DUG on yesterday's breakout because the market had just broken down below an obvious level of support. However, as per the plan mentioned above, we are now monitoring DUG for a potential buy entry on a pullback to its breakout, around the $46 to $47 area. For an approximate price target, we would look for DUG to move back to its prior high from October 10, around the $59 - $60 area. This equates to a 50% Fibonacci retracement from the October high to the November low. If buying DUG on a pullback, consider a tight protective stop below the November 20 low and 20-day MA (around $41) in order to protect against a possible failed breakout. As always, subscribers to The Wagner Daily will receive an Intraday Trade Alert if/when we decide to buy DUG.
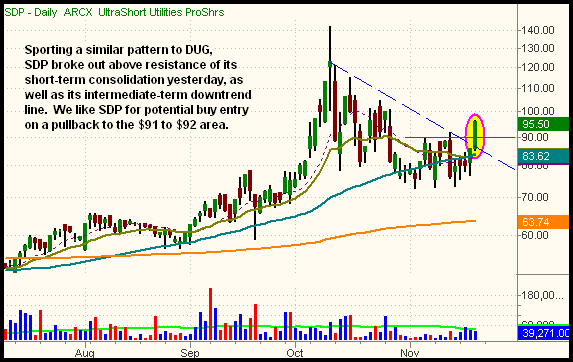
Another inversely correlated ETF we're monitoring for buy entry on a pullback is UltraShort Utilities ProShares (SDP), whose daily chart is shown below:

Prior to yesterday, SDP had been consolidating in a tight range for weeks, holding at support of both its 20 and 50-day moving averages. Yesterday, it broke out above the high of that consolidation, which also corresponds to a breakout above its intermediate-term downtrend line. We like SDP for entry on a pullback to the $92 area.
You may notice that SDP trades an average daily volume of only 45,000 shares. However, unlike individual stocks, in which liquidity can greatly affect how a stock trades, remember all exchange traded funds are synthetic instruments. As such, the amount of average daily volume that an ETF trades is, for the most part, irrelevant. Even if a particular ETF had no buyers or sellers for several hours, the bid and ask prices would continue to move in correlation with the market value of the ETF that is derived from the prices of the underlying stocks. An ETF with a low average daily volume may sometimes have slightly wider spreads between the bid and ask prices, but you can simply use limit orders if this is the case. Since we trade for points, not pennies, paying a few cents more on occasion is not a big deal.
In yesterday's market analysis, we looked at the long-term monthly chart of the S&P 500. We suggested the index would likely test support of its year 2003 low (789), while the year 2002 low of 769 was a key area of long-term support. With yesterday's S&P 500 closing price of 752, both of these support levels have been violated. Nevertheless, this does not mean the index is likely to continue plummeting lower without a significant bounce. On the contrary, we're now looking at a potential "undercut" situation that often leads to short-term bullish price action. If the S&P 500 closes above 769 in today's session, it could give traders a very good reason to start dipping a toe in the water on the long side of the market.
In terms of a reward-risk ratio, new longs at current prices, around support of six-year lows, make sense. Still, we think it makes more sense to wait for the major indices to rally into resistance of their 20 and 50-day moving averages, then initiate new short positions. As per our recent discussion, daytraders may find buying opportunities on the long side of the market, but swing trading on the long side is still quite dangerous. At the very least, we would require the main stock market indexes to move back above resistance of their 10-day moving averages before getting long in trades with a time duration of more than a few hours.
Open ETF positions:
Long - FXY, DGP
Short - (none)
Deron Wagner is the Founder and Head Trader of both Morpheus Capital LP, a U.S. hedge fund, and Morpheus Trading Group, a trader education firm launched in 2001 that provides daily technical analysis of the leading ETFs and stocks. For a free trial to the full version of The Wagner Daily or to learn about Wagner's other services, visit MorpheusTrading.com or send an e-mail to deron@morpheustrading.com.
|