|
The Wagner Daily ETF Report For November 19
The recent tug-of-war between the bulls and bears continued yesterday, as the stock market's erratic, whippy intraday price action of the past several days failed to abate. This time, however, stocks traded in an inverse pattern of the preceding two days. On November 14 and 17, the major indices rallied in the early afternoon, then sold off sharply into the close. But yesterday, the broad market trended lower in the afternoon, then rallied substantially in the final hour of trading. Blue chips led the way higher, enabling the Dow Jones Industrial Average to gain 1.8%. Though the S&P 500 climbed 1.0%, relative weakness in tech stocks held the Nasdaq Composite's advance to just 0.1%. Small and mid-cap stocks failed to make it into positive territory; the Russell 2000 and S&P Midcap 400 indices lost 0.9% and 0.3% respectively. The major indices finished in the upper quarter of their intraday ranges, indicating a rare show of resilience into the close.
Total volume in the NYSE increased 14%, while volume in the Nasdaq rose 26% above the previous day's level. In yesterday morning's commentary, we said that, despite recent losses, the price to volume relationship in the broad market has been positive since the November 13 reversal day. Since yesterday's higher volume gains enabled both the S&P 500 and Nasdaq Composite to score another bullish "accumulation day," that bullish price to volume pattern remains intact. Throughout the dizzying price action of the stock market, there have been two days of institutional buying within the past four days, and two days of losses on lighter volume. Even when price action is deceiving or unclear, volume is the one technical indicator that doesn't lie. It is also one of the few indicators that leads, rather than lags, prices. The stock market's price to volume relationship of the past four days is one of the most encouraging signs for the bulls right now.
Over the past few days, we've received a few e-mails from subscribers who shared their thoughts on the general state of the overall market. The most interesting of these e-mails were several that implied market conditions have changed so drastically that technical analysis has become ineffective or "no longer works." As a professional trader who has made a living from technical analysis of the markets for many years, I instinctively dismissed this suggestion as preposterous. Nevertheless, I decided to study the notion a little further. Several hours and hundreds of charts later, I came to the conclusion that technical analysis indeed continues to work very well, even in this erratic environment. HOWEVER, one thing that seems to have changed, at least temporarily, is the most accurate timeframes in which trends are following through.
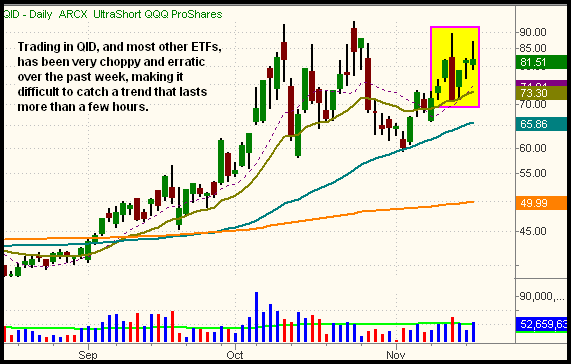
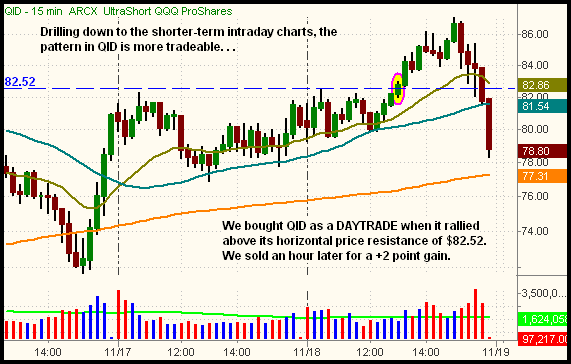
Since inception more than six years ago, the approximate hold time of most ETF positions has been several days to several weeks, depending on the type of chart pattern. Based on this timeframe, the model account of the Wagner Daily ETF portfolio has managed to generate a historical annualized return of more than 20%. Nevertheless, a closer look at our larger than usual percentage of losing trades in recent weeks tells us one of the biggest challenges has been realizing a profit on trades that are held more than a day or two. Confirming this, the few daytrades we've recently taken have generally yielded positive results. Yesterday, for example, we daytraded UltraShort QQQQ ProShares (QID), using real-time Intraday Trade Alerts to inform subscribers of our exact entry and exit points. In just over an hour, we realized a net gain of two points on the trade. But even though QID is an inversely correlated "short" ETF, holding it with our usual time horizon over the past week, without getting "stopped out," would have been extremely difficult. To illustrate this, take a look at the daily chart of QID below:

Even though QID recently bounced off support of its 20-day EMA (the beige line), notice how choppy and erratic price action of the past week has been. This was also the case throughout most of last month. With many ETF charts resembling the choppy mess above, we've recently begun drilling down to a shorter time frame than the daily charts. The resulting analysis has led to intraday trades such as our QID entry yesterday. Check out the 15-minute intraday chart of QID below:

On the 15-minute chart of QID above, notice how nicely the 20-period EMA (the beige line) acted as support throughout November 17, and also the first half of November 18. When the price of QID dipped below the 20-EMA a few times on November 17, the 40-period EMA, the other moving average we use on 15-minute charts, perfectly acted as secondary support. This very short-term price consolidation, with clean moving average support below, prompted us to buy the breakout above the high of the two-day consolidation yesterday afternoon. We bought at the $82.80 area (above the dashed horizontal line), and sold at the $84.80 area just over an hour later. What determined our exit point? A trailing stop that was based on a break below support of an even shorter time frame. For daytrades, we like to use the 15-minute time interval to find the specific trade entry points, then drill down to the 2 or 5-minute charts to micromanage the position. In the case of QID, we used a break below the 20-EMA on the extremely short-term 2 minute chart as our trailing stop.
If you're not willing to, or simply are not able to, trade on an intraday basis, don't worry about it! The indecision and high volatility in the stock market will eventually settle down, enabling trades with a hold time of several days to several weeks to begin working well again. Until that happens, swing traders have the awesome option of sitting in cash, simply preserving capital for more favorable market conditions that will eventually prevail. As a value-added service to subscribers during these challenging market conditions, we'll continue to occasionally point out ideal intraday trade setups as we spot them, but understand daytrades will not replace the short to intermediate-term ETF trade setups that have been our bread and butter over the years.
Above all, don't be frustrated if your technical trade setups that normally yield profitable results have not been working for you lately. If you've been trying to force trades in an unyielding market, the market has not so subtly been reminding us that it just doesn't work. Remember -- we can only ever take what the market is willing to give us! Admittedly, we've recently taken individual ETF swing trade setups that looked good at the time of entry, but unyielding broad market conditions prevented the trades from getting follow-through in the anticipated direction. If this is happening to you, we see only two choices: adjust your strategy to a shorter, preferably intraday time frame to increase your odds of profitability or patiently sit on the sidelines, preserving cash until more favorable market conditions enable your strategy to begin working again.
Open ETF positions:
Long - DGP
Short - (none)
Deron Wagner is the Founder and Head Trader of both Morpheus Capital LP, a U.S. hedge fund, and Morpheus Trading Group, a trader education firm launched in 2001 that provides daily technical analysis of the leading ETFs and stocks. For a free trial to the full version of The Wagner Daily or to learn about Wagner's other services, visit MorpheusTrading.com or send an e-mail to deron@morpheustrading.com.
|