|
The Wagner Daily ETF Report For November 18
Following a somewhat similar pattern as the previous day's session, the major indices drifted lower in the morning, reversed to new intraday highs in the early afternoon, then fell back to their session lows in the final minutes of trading. Volatility was a bit lower than during last Friday's whippy session, as the broad market traded in a tight, sideways range throughout much of the afternoon. Nevertheless, another "bear attack" into the close caused stocks to register substantial losses. The Nasdaq Composite shed 2.3%, while the S&P 500 and Dow Jones Industrial Average registered identical losses of 2.6%. Small and mid-cap stocks were relatively quiet for a change; the Russell 2000 and S&P Midcap 400 indices declined 1.1% and 1.6% respectively. All the main stock market indexes closed at or near their intraday lows.
As with the previous day's losses, declining turnover was the one positive element of the session. Total volume in the NYSE receded 9%, as volume in the Nasdaq dropped 18%. Though the losses of the past two days have been large, the lack of a corresponding volume surge tells us institutions have not been aggressively running for the exit doors. Since two days of lower volume losses have followed the higher volume "accumulation day" of October 13, the market's price to volume pattern over the past few days has actually been positive. Market internals, however, have been firmly negative. Yesterday, in both exchanges, declining volume exceeded advancing volume by a margin of approximately 5 to 1.
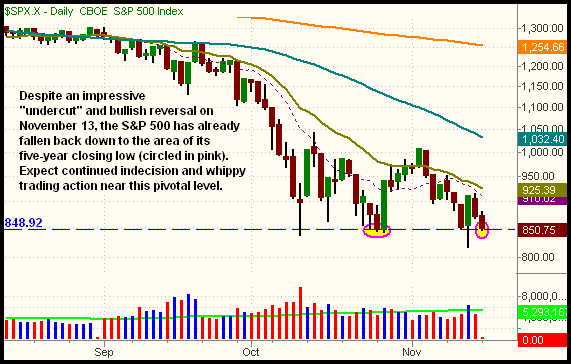
It's been a wild, choppy ride over the past three days that has made it equally challenging to hold long or short positions. On November 13, the S&P 500 and Nasdaq Composite both "undercut" key support of their October 2008 lows intraday, triggering a wave of sell orders that sent the major indices 3% lower in just 15 minutes. But buyers subsequently stepped in just as quickly, launching stocks approximately 10% higher (from their intraday lows to the closing bell). The broad market followed up that action by selling off sharply the following morning, reversing to its highest levels of the day in the early afternoon, then plummeting to close at its intraday lows in the final minutes of trading. Yesterday's pattern was similar as well. Now, the S&P 500 is again positioned to test support of its five-year lows:

As illustrated by the dashed horizontal line on the chart above, the S&P 500 closed just two points above its five-year closing low of 848.92, which was set on October 27. Because this is such an important area of support, expect to see continued indecision in the short-term, as the bulls and bears fight for dominance. The "triple bottom" that has been put in place will add to the tug-of-war. The recent price action of November 13 shows how quickly sentiment can reverse when stocks are trading near such pivotal support levels. Technically, the intraday low of November 13 (818.69) should now act as support as well, but all eyes will still be on last month's lows.
Leading the S&P 500 lower, the Nasdaq Composite already set a fresh five-year closing low yesterday. However, the index only did so by a narrow margin, and the Nasdaq is still firmly above its intraday low of November 13:

When the major indices dipped to new multi-year lows on the morning of November 13, we bought two ProShares UltraShort ETFs (Oil and Gas [DUG] and Emerging Markets [EEV]). Initially, both inversely correlated ETFs showed large gains as stocks plunged sharply at mid-day. However, when the major indices rallied all the way back to their breakdown levels an hour later, we were forced to scratch the positions (sell near breakeven). This was a fortunate move, as the main stock market indexes subsequently ripped more than 6% higher that day.
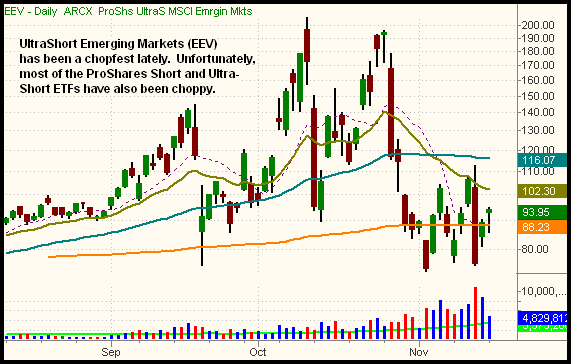
As the major indices began retracing more than two-thirds of the rally off the November 13 lows yesterday afternoon, we began scanning for new short positions to consider. However, not surprisingly, the charts of the Short and UltraShort ETFs have been a sloppy, choppy mess, with no ideal entry points right now. UltraShort Emerging Markets ProShares (EEV), for example, gained 5.5% yesterday, but its price action in recent weeks is a chopfest:

Of the entire realm of inversely correlated ETFs, UltraShort Technology ProShares (REW) may be one of the best setups. Its trading range has been wide in recent weeks, but it's poised to break out to a fresh high. Daytraders may want to consider buying REW on a rally above yesterday's high, but we do not suggest this trade for anybody who wishes to hold overnight. Day-to-day price action is simply too erratic to do so. For swing traders, cash is definitely king right now!
Open ETF positions:
Long - DGP, BBH
Short - (none)
Deron Wagner is the Founder and Head Trader of both Morpheus Capital LP, a U.S. hedge fund, and Morpheus Trading Group, a trader education firm launched in 2001 that provides daily technical analysis of the leading ETFs and stocks. For a free trial to the full version of The Wagner Daily or to learn about Wagner's other services, visit MorpheusTrading.com or send an e-mail to deron@morpheustrading.com.
|