|
The Wagner Daily ETF Report For November 17
Stocks concluded another volatile week of trading with a session of roller coaster price action last Friday. The broad market trended lower throughout the morning, causing the major indices to retrace more than half of their previous day's gains by mid-day. The tone abruptly changed in the afternoon, as the bulls rallied the main stock market indexes to new intraday highs, and even into positive territory for the day. But the bears struck back in the final hour of trading, shockingly sending stocks back down to close at fresh lows of the day. The Dow Jones Industrial Average fell 3.8%, the S&P 500 4.2%, and the Nasdaq Composite 5.0%. Giving traders a bad case of whiplash, the small-cap Russell 2000 gave back 7.1% of the prior day's 8.5% gain. The S&P Midcap 400 declined 5.3%.
Turnover declined substantially last Friday, slightly easing the blow of the day's losses. In both the NYSE and Nasdaq, total volume decreased 24% below the previous session's respective levels. Higher volume losses immediately following the bullish "accumulation day" of October 13 would have been quite negative, so it's positive that trading at least slowed. Volume in both exchanges also came in below average levels. Across the board, market internals were roughly as negative as they were positive the previous day. Declining volume in the NYSE and Nasdaq exceeded advancing volume by a ratio of 9 to 1.
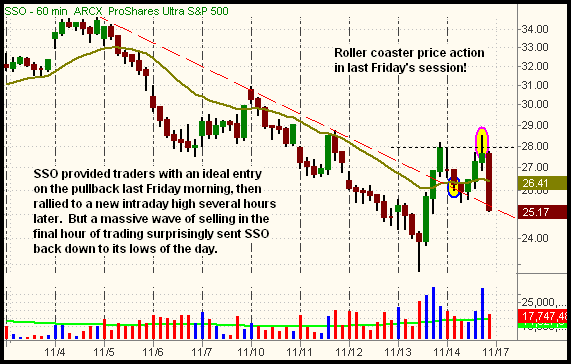
After the strong gains and bullish reversal of November 13, we said, "In the short-term, our plan is to wait for the major indices to approach support of their 20-period exponential moving averages on the hourly chart (20-EMA/60 min). During trend reversals, waiting for the major indices to touch their 20-EMA/60 min., rather than chasing a parabolic rally, is an ideal way to participate in the bullishness with a controlled level of risk." As per our pre-determined plan, that's exactly what we did last Friday, buying a partial position of Ultra S&P 500 ProShares (SSO) when it pulled back to touch its 20-EMA/60 min. just over an hour into the session. SSO subsequently probed a bit lower and kept finding support at its previous hourly downtrend line. This eventually triggered a powerful rally to a new high of the day, but a massive wave of selling in the final hour sent SSO back to its lows. Take a look at the hourly chart of SSO:

On the chart above, the beige line is the 20-EMA/60 min., a great indicator of short-term support or resistance we commonly use. The first pullback to that moving average, around $26.40, marks our buy entry (circled in blue). Waiting for that pullback was, of course, much safer than buying into strength near the previous day's close. After our entry, notice SSO drifted a bit lower, but found support at its prior hourly downtrend line (the red dashed line) -- remember that a prior level of resistance becomes the new level of support after the resistance is broken. These technical levels of support prompted the rally that launched SSO to a new intraday high (circled in pink), but a surprise wave of selling in the final hour caused SSO to settle at its lowest level of the day. Going into today, notice SSO is still holding support of its prior hourly downtrend line.
In the November 14, 2008 issue of The Wagner Daily, we summarized our thoughts on the previous day's rally by saying, "After recent losses in the market, it may be easy to get excited about yesterday's (November 13) bullish reversal and strong gains. But be aware that, including yesterday, there have been three such days of massive gains within the past month. Recall the S&P 500 rallied 11.6% on October 13, and 10.7% on October 28. What was the outcome of those days? Both times, the S&P 500 fell back to its prior lows just two weeks later." Although the broad market's "undercut" of its October 2008 lows, along with its "triple bottom" formation, was bullish, we were generally cautious about the lack of recent upside follow-through, and still are. Nevertheless, if one doesn't use technical analysis to take at least some degree of risk when ideal patterns present themselves, one is not doing his job and will never get paid. That's why we bought SSO on a pullback to the 20-EMA/60 min., and then bought a small position of Biotech HOLDR (BBH) later in the day. Yet, we didn't go overboard with aggressive buying operations. If last week's reversal attempt gets some legs, there will be plenty of time to take advantage of opportunities that develop in the near-term. Until then, we're taking a "wait and see" approach before entering any additional ETF trades.
Open ETF positions:
Long - DGP, SSO, BBH
Short - (none)
Deron Wagner is the Founder and Head Trader of both Morpheus Capital LP, a U.S. hedge fund, and Morpheus Trading Group, a trader education firm launched in 2001 that provides daily technical analysis of the leading ETFs and stocks. For a free trial to the full version of The Wagner Daily or to learn about Wagner's other services, visit MorpheusTrading.com or send an e-mail to deron@morpheustrading.com.
|