|
The Wagner Daily ETF Report For November 3
The stock market concluded a strong week of gains on a positive note last Friday, but the major indices still suffered their worst monthly losses in decades. After opening slightly lower, stocks reversed to drift higher throughout the day. A bit of selling pressure in the final hour of trading pulled stocks off their intraday highs, but the bulls returned in the final minutes of trading. The Dow Jones Industrial Average gained 1.6%, the S&P 500 1.5%, and the Nasdaq Composite 1.3%. Small and mid-cap stocks continued to roar back from their lows, again outperforming their large-cap brethrens by a wide margin. The Russell 2000 and S&P Midcap 400 indices climbed 4.5% and 2.9% respectively. The Russell 2000 closed near its best level of the day, but the rest of the main stock market indexes finished near the upper third of their intraday ranges.
Unfortunately, mutual funds, hedge funds, and other institutions showed indifference about last Friday's gains, as evidenced by lower turnover across the board. Total volume in the NYSE eased 4%, while volume in the Nasdaq declined 7% below the previous day's level. Trading in both exchanges also fell below 50-day average levels. Although last week's broad market percentage gains were the largest in years, it's concerning that stocks advanced on higher volume only once (October 28). This tells us institutional traders, who typically account for a majority of the stock market's average daily volume, primarily remain on the sidelines. Without the support of institutional accumulation, rally attempts can unravel easily, with just one round of moderate selling by the bears. The NYSE advancing/declining volume ratio was positive by 3 to 1. However, despite a gain of more than one percent, advancing volume in the Nasdaq was only on par with declining volume.
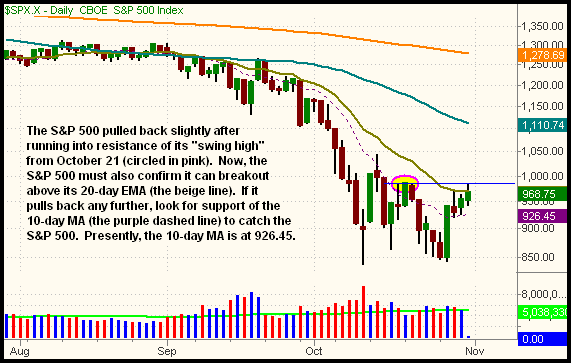
Last Friday, the blue-chip Dow Jones Industrial Average closed above resistance of its 20-day exponential moving average (EMA) for the first time in six weeks. While this is an encouraging sign, neither the S&P 500 nor the Nasdaq Composite have followed suit. On an intraday basis, both exchanges probed above their 20-day EMAs in their most recent session of trading, but failed to close above it. Resistance of the S&P 500's prior "swing high," from October 21, also kept the index's gain in check last Friday. On the daily chart of the S&P 500 below, the blue horizontal line shows how resistance of the October 21 high coincided with last Friday's intraday high. The 20-day EMA is the beige line:

Going into today, technical traders will be focused on whether or not the 20-day EMAs will continue to provide resistance to the S&P 500 and Nasdaq Composite, which also closed right below its 20-day EMA last week. One possible scenario is that the S&P, Nasdaq, and Dow will pull back to new support of their 10-day moving averages (the dashed purple line on the chart above). Acting as an indicator of short-term resistance prior to last week's rally, the 10-day MA should now provide short-term support when stocks pull back. Remember the most basic tenet of technical analysis; a prior level of resistance becomes the new support level, after the resistance is broken (and vice versa). If the major indices pull back to the vicinity of their 10-day MAs today, the retracement is a low-risk trade setup to buy one or more of the broad-based ETFs.
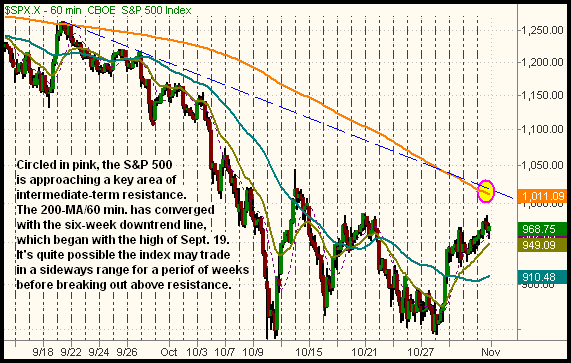
Rather than pulling back, another scenario is that the S&P 500 simply gaps up above last Friday's high, and hence resistance of its October 21 "swing high" as well. Although such a move might seem bullish on the surface, one problem is that another significant level of resistance lies just overhead. This is shown on the shorter-term hourly chart of the S&P 500 below:

The primary intermediate-term downtrend line of the S&P 500, the blue dashed line, began with the high of September 19. Since it's been in effect for the past six weeks, the S&P 500 is likely to pull back significantly on the first touch of that resistance level. Further, notice how the 200-period moving average on the hourly chart (200-MA/60 min.) also converges in the same area as that downtrend line. As discussed thoroughly in my new book, Trading ETFs: Gaining An Edge With Technical Analysis, resistance or support of the 200-period moving average is typically like a "brick wall" -- regardless of the time interval being analyzed. Convergence of the six-week downtrend line and 200-MA/60 min. does not mean last week's bottoming action was not legitimate; rather, it implies the S&P 500 (and other broad-based indexes) could easily enter a multi-week (or longer) period of choppy, sideways trading. Nevertheless, even if that occurs, overall volatility is likely to continue settling down from October's incredible ranges. Lower volatility makes it less dangerous to enter new swing trades. Additionally, ETFs with relative strength can still trend higher, even as the broad market drifts sideways.
Aside from the above technical resistance levels to overcome, low volume levels in recent weeks have been a big concern. When markets enter into counter-trend, bear market rallies, the only way the bounce can possibly turn into something more substantial is if higher volume accompanies many of the "up" days. Last week, however, stocks only managed to score one "accumulation day" (a session of higher volume gains). Below is a daily bar chart of total NYSE volume. Notice how overall volume has been trending lower since the S&P 500 marked its low on October 10:

Since overall volume is trending lower as the S&P 500 tries to form a bottom, this is the exact opposite type of price to volume relationship the bulls want to see. If the market attempts to continue its bullishness this week, pay close attention to whether increasing volume accompanies the gains as well. If it does, we'll know institutions are gradually jumping back in the market to support the price of stocks. But until that happens, bulls should be very cautious with new long entries, especially in broad-based ETFs such as S&P 500 SPDR (SPY) or Nasdaq 100 Tracking Stock (QQQQ). Buying only on pullbacks to the 10-day moving averages, or even 20-period exponential moving averages on the hourly charts, is a good way to increase your reward/risk ratio of any new trade entries on the long side. Tomorrow, we'll take an updated look at which ETFs are showing the most relative strength to the broad market.
Open ETF positions:
Long - DGP
Short - (none)
Deron Wagner is the Founder and Head Trader of both Morpheus Capital LP, a U.S. hedge fund, and Morpheus Trading Group, a trader education firm launched in 2001 that provides daily technical analysis of the leading ETFs and stocks. For a free trial to the full version of The Wagner Daily or to learn about Wagner's other services, visit MorpheusTrading.com or send an e-mail to deron@morpheustrading.com.
|