| The Wagner Daily ETF Report For October 28 |
| By Deron Wagner |
Published
10/28/2008
|
Stocks
|
Unrated
|
|
|
|
The Wagner Daily ETF Report For October 28
Stocks meandered through another choppy, range-bound day of trading, oscillating between positive and negative territory throughout the session. After opening lower, late-morning buying interest lifted the major indices to intraday gains of approximately 2%, but a vicious drop minutes before the closing bell caused stocks to settle substantially lower. Likely driven by forced institutional liquidation of assets, weakness in the concluding minutes of trading has become common. Finishing below its prior low of October 10 and suffering its fifth straight day of losses, the Nasdaq Composite tumbled 3.0%. Setting new five-year closing lows, but still holding above their October 10 lows, the S&P 500 and Dow Jones Industrial Average shed 3.2% and 2.4% respectively. The small-cap Russell 2000 plunged 4.8%, as the S&P Midcap 400 lost 4.3%. Like the Nasdaq, both indexes are trading at their lowest levels of the month, as well as the past five years. Each of the major indices closed at its worst level of the day.
If there was anything good about yesterday's session, it's that turnover in both exchanges eased to below average levels. Total volume in the NYSE declined 15% below the previous day's level, while volume in the Nasdaq similarly receded 14%. In each of the past two days, stocks have registered substantial losses, but on lighter volume both times. This hints that a mere lack of buyers, rather than a continued abundance of sellers, has been the main reason for the decline of the past two sessions. Still, in order to reverse the market's bearish momentum, there needs to be an impetus for the bulls to start aggressively jumping back in the market, rather than just dabbling on intraday dips.
Opposite of the previous two days, the S&P and Nasdaq futures are presently indicating opening prices of approximately 4% higher in the pre-market session. However, even if the S&P 500 and Nasdaq 100 open at these levels, realize the main stock market indexes will still be trading below yesterday's highs; the broad market's drop in the final fifteen minutes of trading was so swift. Further, since yesterday's intraday highs of the major indices were roughly on par with their October 24 highs, consider waiting for a rally above the highs of the past two days before entertaining the thought of any long positions. Such a rally would also put the main stock market indexes back above their 20-period exponential moving averages on the hourly charts (20-EMA/60 min.), which has perfectly acted as resistance over the past week. The short-term breakout levels of the S&P 500 and Nasdaq Composite are shown on the hourly charts below:
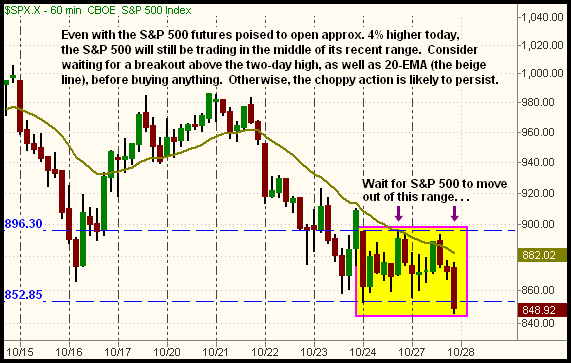
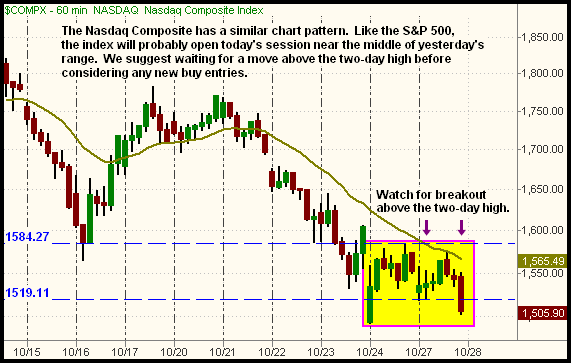
Unless the major indices break out above resistance of their two-day highs and 20-EMA/60 min., there remains a strong chance stocks will just continue to chop around in the sideways ranges they've recently established. Even if we see short-term breakouts above the two-day highs, there is still way too much overhead supply, as well as secondary hourly downtrend lines, to aggressively begin buying operations right now.
At the very least, we need to see confirmation the main stock market indexes are capable of moving back above their 10-day moving averages (S&P 500 - 926, Dow Jones - 8,778, Nasdaq Composite - 1,658), before declaring the possibility of a short-term trend reversal for new buy entries. As for the intermediate-term trends (3 to 6 weeks out), we view any substantial bounce as a short-selling opportunity. If presently maintaining any short positions you've been riding lower, a logical place to cover and lock in gains in just above the two-day highs and/or 20-EMA/60 min. as well. For the UltraShort ETFs, the selling point would conversely correlate to a break below the two-day lows and/or 20-EMA/60 min.
Open ETF positions:
Long - DGP
Short - (none)
Deron Wagner is the Founder and Head Trader of both Morpheus Capital LP, a U.S. hedge fund, and Morpheus Trading Group, a trader education firm launched in 2001 that provides daily technical analysis of the leading ETFs and stocks. For a free trial to the full version of The Wagner Daily or to learn about Wagner's other services, visit MorpheusTrading.com or send an e-mail to deron@morpheustrading.com.
|


 Free Festival of Traders Videos