|
The Wagner Daily ETF Report For October 23
Plummeting on sharply higher volume yesterday, stocks gave a death knell to the broad market's recent rally attempt. The main stock market indexes opened substantially lower, traded sideways for a few hours, then suffered another leg down in the afternoon. The Nasdaq Composite tumbled 4.8%, the Dow Jones Industrial Average 5.7%, and the S&P 500 6.1%. The small-cap Russell 2000 lost 5.4% and the S&P Midcap 400 fell 5.9%. Fifteen minutes before the closing bell, the major indices were actually showing losses of approximately 2% more, but a quick bounce in the final minutes of trading enabled stocks to finish above their worst levels of the day.
Volume rushed higher across the board, causing the Nasdaq to register its second straight "distribution day." In both the NYSE and Nasdaq, total volume increased 20%, and also moved back above 50-day average levels. In yesterday's commentary, we said of Tuesday's sell-off in the Nasdaq, "Though it was the first display of institutional selling since the stock market's bullish reversal of October 16, it is negative to see a session of higher volume losses so soon after a high-volume reversal day." Unfortunately, this analysis proved to be right, causing downside momentum to greatly intensify yesterday.
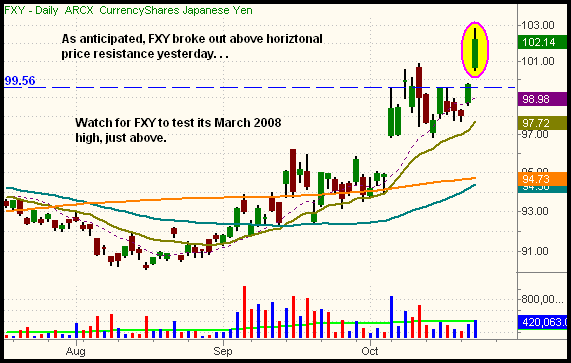
Yesterday, we pointed out the bullish chart pattern and potential breakout of CurrencyShares Japanese Yen (FXY). Opening substantially higher, then rallying intraday, FXY is now only a point away from testing its 52-week high that was set in March of 2008. Because the currency ETFs are so sensitive to overnight price movements, we passed on re-entering FXY this time around. Nevertheless, we hope some of you took advantage of trading it after yesterday's breakout opening gap:

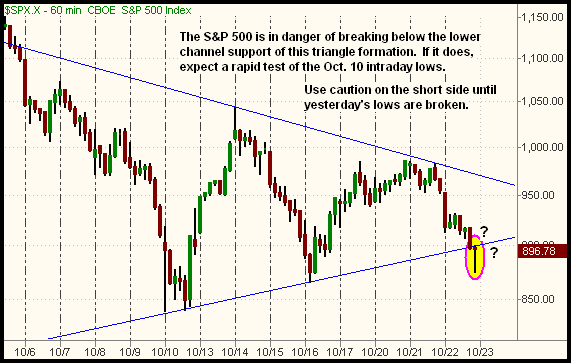
When Tuesday's roller coaster session led to a broad-based round of losses, the most technically damaging aspect was the higher volume in the Nasdaq. The chart patterns of the major indices, however, were still okay. Though the broad market had pulled back, it was still consolidating relatively near the highs of this week's range. But after yesterday's sizeable losses, the charts are once again looking pretty ugly. Both the S&P 500 and Nasdaq Composite settled at fresh five-year closing lows, but held above their intraday lows of October 10. Looking at the shorter-term hourly charts, one can see the overall market is in a precarious position. Below is an hourly chart of the benchmark S&P 500 Index (with moving averages removed). All the major indices are sporting similar patterns as the S&P 500:

Annotated by the blue trendlines on the chart above, the S&P 500 has been forming a "symmetrical triangle" chart pattern. This occurs when the price pattern is moving sideways between two converging trendlines; the upper trendline (resistance) is declining, and the lower trendline (support) is rising. This pattern represents an overall equilibrium between buyers and sellers, though volatility has been extremely wild in recent weeks. With this pattern, the eventual breakout through either trendline signals the direction of the market's next move. In the last hour of yesterday's session, the S&P 500 fell below the lower channel support, but notice how it reversed to close right at its trendline.
With patterns such as the "symmetrical triangle," it's not uncommon to see an intraday "shakeout" below support, or above resistance, before the price pattern reverses in the opposite direction. If today's session closes significantly higher, we'll know that was the case. However, it's now quite possible yesterday's lows will be broken, causing stocks to rapidly decline to test support of their October 10 lows (the first anchor of the hourly uptrend line). Nobody knows which scenario will play out today; the only thing we can say with a great degree of confidence is this morning's session is likely to be whippy. Be prepared.
If yesterday's lows are broken, there's a good chance a test of the October 10 lows will rapidly follow suit. As such, daytraders may find opportunities in the inversely correlated ProShares UltraShort ETFs. However, swing traders who hold positions a few days may want to pass on new short entries here because the October 10 lows are obvious, key areas of support in the major indices that could trigger a wave of buying momentum again. If the October 10 lows are convincingly broken, new short entries would be safer, as it could start another leg down that leads to a test of the year 2002 bear market lows.
We waited for the proper technical signal of a bullish reversal day on higher volume (October 16) before buying new ETF positions this week. Through careful analysis, we subsequently entered ETFs with the most relative strength during the subsequent bullish consolidation. Still, it didn't matter. Even ETFs with clear relative strength will eventually capitulate if the broad-based selling pressure is substantial enough, so we're now flat again, waiting to see how the main stock market indexes react to their tightening "symmetric triangle" patterns.
Open ETF positions:
Long - (none)
Short - (none)
Deron Wagner is the Founder and Head Trader of both Morpheus Capital LP, a U.S. hedge fund, and Morpheus Trading Group, a trader education firm launched in 2001 that provides daily technical analysis of the leading ETFs and stocks. For a free trial to the full version of The Wagner Daily or to learn about Wagner's other services, visit MorpheusTrading.com or send an e-mail to deron@morpheustrading.com.
|