|
The Wagner Daily ETF Report For October 20
A wobbly session of trading led to moderate losses last Friday, but all the major indices finished with solid weekly gains for a change. After gapping lower on the open, the bulls quickly stepped in, sending the Dow to a 3% intraday gain by early afternoon. However, stocks fell back down in the final two hours of the day. The Nasdaq Composite lost 0.4%, the S&P 500 0.6%, and the Dow Jones Industrial Average 1.4%. The Russell 2000 Index led the broad market lower with its 1.9% decline, but the small-cap index also scored the largest gain the previous day. The S&P Midcap 400 dropped 0.4%. Although the main stock market indexes closed in the bottom third of their intraday ranges, they still retained a majority of their gains from the previous day's bullish reversal day. Breaking a four-week losing streak, the Dow Jones Industrial Average registered a 4.7% weekly gain. The S&P 500 similarly climbed 4.6%, as the Nasdaq Composite advanced 3.7%.
Despite last Friday coinciding with monthly options expiration, turnover eased across the board. Total volume in the NYSE receded 12%, while volume in the Nasdaq decreased 19%. Since stocks pulled back after the previous session's high-volume "accumulation day," it's positive that the decline occurred on quieter trading activity -- especially when considering that options expiration days usually trigger an uptick in volume. Although stocks finished the day with losses, the lighter volume tells us the major indices were merely digesting the previous day's gains. Higher volume, conversely, would have hinted at institutional selling into strength.
Even though the main stock market indexes declined last Friday, intraday price action was more bullish than we've been seeing lately. First, it was encouraging that stocks swiftly reversed into positive territory after starting the day substantially lower. This is indeed the type of price action the market should exhibit after a bullish reversal day on higher volume. The broad market moved lower in the final two hours of trading, but the decline could have easily been a byproduct of monthly options expiration day. Considering the major indices gained approximately 5% the previous day, last Friday's losses were relatively small. Volatility, however, remained quite high.
In the October 17, 2008 issue of The Wagner Daily, we illustrated how the high-volume, bullish reversal of October 16 caused the major indices to form "higher lows" on their daily charts, which indicated a possible change of tone from the market's recent weakness. Since stocks exhibited decent price action the following day, there is now a good chance they'll demonstrate continuing strength in the coming week. As such, let's take a look at where the major indices may run into short-term price resistance along the way.
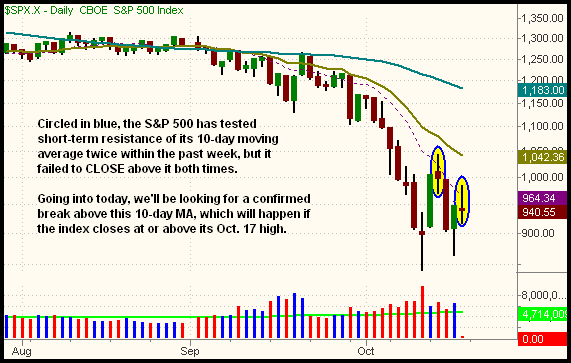
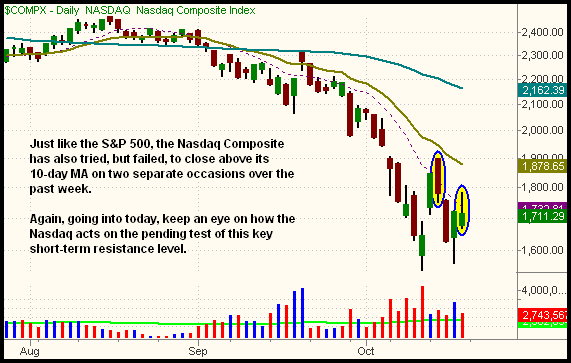
Going into today, the most immediate area of resistance to monitor is the intraday highs of last Friday (October 17). Since the main stock market indexes closed in the bottom third of their intraday ranges, this will be a significant test of merit. This is compounded by the fact that the the major indices also tested resistance of their 10-day moving averages last Friday, but failed to close above them. Below are daily charts of the S&P 500 and Nasdaq Composite. The dashed, purple line is the 10-day moving average. Notice how that indicator has perfectly acted as closing price resistance in recent weeks:


Notice how the S&P 500 and Nasdaq Composite probed above their 10-day moving averages on both October 14 and 17, but failed to close above this key area of short-term price resistance. Because it has been many weeks since these indexes actually closed above their 10-day moving average, the ability of them to do so in today's session would be a bullish sign for the market. Just a close at or above last Friday's highs would cause that to happen. If stocks happen to rip through last Friday's highs, the next major area of resistance will be the 20-day exponential moving averages (EMAs), indicated by the beige lines on the charts above.
If stocks happen to decline today, the major indices should hold support of their October 17 intraday lows, which were formed last Friday morning. It would be bearish if they don't, as this would cause a violation of the 20-EMAs on the hourly charts, which stocks just broke out above of. But as long as the main stock market indexes hold above the previous day's lows, our short-term bias is cautiously bullish. Intermediate-term bias remains neutral until we see the formation of some "higher highs" to accompany last week's "higher lows" that were formed. Long-term trends, of course, remain firmly bearish at this time.
Since we preferred to stay on the sidelines during options expiration day, we are presently flat. However, we'll be scanning for new ETF buy entries in the coming week. So far, we've not detected significant relative strength in any industry sectors; biotech and medical ETFs are possibilities. We're also monitoring the performance of the financial sector, as it has been a leading indicator of the broad market lately. Anything bought right now should be entered with a more aggressive profit-taking stance, as well as tight protective stops, at least until the major indices confirm the developing rally off the lows will remain firm.
Open ETF positions:
Long - (none)
Short - (none)
Deron Wagner is the Founder and Head Trader of both Morpheus Capital LP, a U.S. hedge fund, and Morpheus Trading Group, a trader education firm launched in 2001 that provides daily technical analysis of the leading ETFs and stocks. For a free trial to the full version of The Wagner Daily or to learn about Wagner's other services, visit MorpheusTrading.com or send an e-mail to deron@morpheustrading.com.
|