|
The Wagner Daily ETF Report For October 8
Bullish candlestick chart patterns on Monday? What "hammers?" Completely ignoring the reversal patterns formed by Monday's late-afternoon, high volume rally, the main stock market indexes plunged sharply lower yesterday, taking out the lows of the previous day's wide trading ranges. Maintaining the trend of extremely high volatility we've been seeing lately, all the major indices plummeted more than 5% yesterday. The Dow Jones Industrial Average nosedived 5.1%, the S&P 500 5.7%, and the Nasdaq Composite 5.8%. The small-cap Russell 2000 tumbled 6.2%, as the S&P Midcap 400 shed 5.4%. All the major indices limped in to the finish line at their worst levels of the day.
Volume receded from Monday's swift pace, but remained above 50-day average levels. Total volume in the NYSE declined 12%, while volume in the Nasdaq eased 19%. Market internals returned to being just plain ugly. In both the NYSE and Nasdaq, declining volume blew away advancing volume by a margin of approximately 20 to 1.
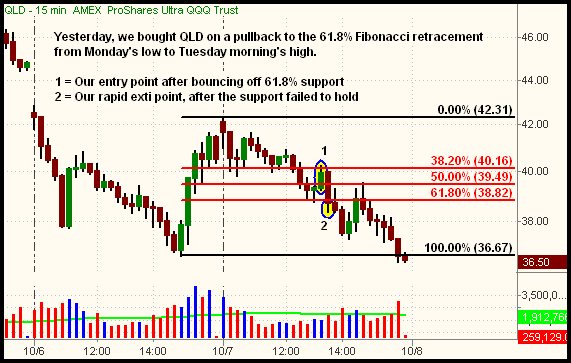
Because of Monday's bullish reversal pattern that occurred late in the day, we liked the reward/risk ratio of lightly "dipping a toe in the water" on the long side when the broad market pulled back early yesterday afternoon. As such, we bought Ultra Nasdaq 100 ProShares (QLD) when it retraced to its short-term 61.8% Fibonacci retracement level from Monday's low to Tuesday morning's high. The bounce at that retracement level came right on cue, but the bears quickly took control, causing the rally attempt to fizzle out less than an hour later. Below, the 15-minute intraday chart of QLD shows our entry point, as well as the price we stopped out:

Even though our QLD trade stopped out pretty quickly (for a smaller than average loss), our entry point represented the lowest risk point to enter a new long position if Monday's reversal was to follow through to the upside. Considering QLD subsequently moved much lower, our stop was in the right place, and the loss was minimal. Meanwhile, CurrencyShares Japanese Yen Trust (FXY), our only other open position, performed well yesterday. It gapped lower on the open, but trended higher throughout the day, closing slightly higher.
Yesterday, the S&P 500, Nasdaq Composite, and Dow Jones Industrial Average each closed at a fresh five-year low. Over the past several weeks, we've pointed out the necessity of the major indices holding key support of their 61.8% Fibonacci retracement levels (from their October 2002 lows to October 2007 highs), but that's quickly become a distant memory. Trading below the 1,000 mark, the S&P 500 has already fallen more than 100 points below the 61.8% retracement level. Put simply, the benchmark S&P 500 has erased more than two-thirds of its preceding five years of gains in just one year. Shockingly, half of that loss has occurred in just the past three weeks!
Recently, we said that a confirmed violation of the 61.8% retracement levels could easily lead to a retracement all the way down to the year 2002 lows. Given the losses of the past few days, that indeed is a very realistic scenario. Though we didn't expect a complete retracement to happen so quickly, it may ultimately be positive for the market if the drop happens sooner, rather than later. The faster and more violently a market sells off, the greater the eventual bounce will be. Though it may seem difficult to keep in context at the moment, please remember that, just as markets don't rally higher in a straight line forever, they also don't fall straight down without substantial, tradeable bounces occurring along the way.
Given that I began my trading career in 1998, this isn't the first bear market I've participated in. Nevertheless, it is indeed the most volatile, erratic market I've seen. But since the entire financial world is changing before our eyes, this is not surprising. Because there is never a reward without some degree of controlled risk, we've admittedly taken a few shots at the long side of the market in recent weeks, but only after seeing clear technical signs of a potential bullish reversal. Although these plays have generally not worked out, our losses have been small in comparison to the gains we've realized so far this year. This, of course, is much different than aggressively gambling to call a bottom, which would have quickly led to surrendering years of gains in just a few months.
In hindsight, we're not afraid to admit we could have played the short side of the market a little more than we did. Now, however, the reward/risk ratio of getting short at such depressed levels is not very good. Also, we know that downward moves in most markets are short-lived, and often followed by fast and furious reversals that are not fun to be caught in. Being mostly in cash is safer, as it allows us to stay nimble and capture gains from the countertrend bounce that will inevitably follow. Patience pays big dividends in the stock market, so let's continue keeping our powder dry, with minimal risk, until the time is right to strike like a ninja waiting in the woods!
Open ETF positions:
Long - FXY
Short - (none)
Deron Wagner is the Founder and Head Trader of both Morpheus Capital LP, a U.S. hedge fund, and Morpheus Trading Group, a trader education firm launched in 2001 that provides daily technical analysis of the leading ETFs and stocks. For a free trial to the full version of The Wagner Daily or to learn about Wagner's other services, visit MorpheusTrading.com or send an e-mail to deron@morpheustrading.com.
|