|
The Wagner Daily ETF Report For October 3
Well, so much for resilience. Despite acting well by retaining most of their September 30 gains in the preceding session, stocks got slammed again yesterday. After opening lower, the broad market trended steadily lower throughout the entire day, causing most of the major indices to finish at or below their recent lows. With the exception of the Dow, all the main stock market indexes plunged at least 4% yesterday. The Dow Jones Industrial Average fell 3.2%, the S&P 500 4.0%, and the Nasdaq Composite 4.5%. Small and mid-cap stocks showed substantial relative weakness for a second straight day. Nosediving to new multi-year lows, the Russell 2000 and S&P Midcap 400 indices tumbled 5.1% and 5.6% respectively. All the major indices closed near their intraday lows.
Total volume in both the NYSE and Nasdaq rose 15% above the previous day's levels. The higher volume losses indicated the return of institutional selling, but turnover was well below the fast pace that accompanied the humongous sell-off of September 29. Still, market internals were just plain ugly! In the NYSE, declining volume exceeded advancing volume by a margin of 9 to 1. The Nasdaq adv/dec volume ratio was negative by a shocking ratio of more than 20 to 1. Losses were logged by nearly every stock, from every major industry sector, confirming the extremely bearish breadth.
In yesterday's commentary, we analyzed the long-term chart patterns of the S&P 500, Nasdaq Composite, and Dow Jones Industrial Average. Overall, the major indices were roughly holding at support of their 50% Fibonacci retracement from their October 2002 lows to October 2007 highs, but we cautioned that further significant selling pressure would likely cause the S&P and Dow to drift down to their 61.8% Fibonacci retracement support levels, technically the last bastion of hope that could enable the 2002 to 2007 uptrend to remain intact.
After yesterday's sell-off, both the S&P and Dow are now sitting mid-way between their 50% and 61.8% Fibonacci retracements. The Nasdaq Composite closed right at its 50% retracement. Unless the S&P and Dow immediately snap back sharply today, odds are now much greater that both indices will fall to test their 61.8% retracement levels next week. For the S&P 500, the 61.8% retracement level is around the 1,077 level, just 3.3% below yesterday's closing price. The Dow's equivalent retracement level is at the 9,871 area, 5.8% lower than its current price.
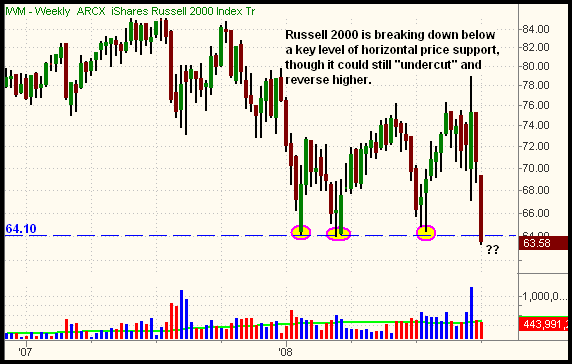
Because investors generally focus on the performance of the S&P 500, Dow Jones Industrials, and Nasdaq Composite, many may not have realized that the small-cap Russell 2000 and S&P Midcap 400 indices were holding up better than the "big 3" stock market indexes throughout the recent market weakness. Prior to yesterday, both the small and mid-cap benchmark indexes were showing long-term relative strength by managing to hold at just their 38.2% Fibonacci retracement levels (from their 2002 lows to 2007 highs). However, these indexes are now catching up to the major weakness in the S&P, Dow, and Nasdaq, as both indices are approaching their 50% retracement levels. Take a look at the weekly chart of the iShares Russell 2000 Index (IWM), a popular ETF proxy for the Russell 2000 Index:

Notice how the Russell 2000 has begun to break down below a key area of horizontal price support (marked by the horizontal line), though not yet by a convincing margin. It would actually be bullish if the Russell 2000 "undercuts" this support level, then quickly rallies back into the prior range, but the bullish reversal would need to happen within the next 1 to 3 days. Otherwise, small caps are likely to be very pressured next week. If the Russell 2000 fails to recover and you wish to initiate a bearish position, TWM is the ticker symbol for the inversely correlated UltraShort Russell 2000 ProShares. MZZ is the ticker for UltraShort S&P Midcap 400 ProShares.
Until the market stops violently whipping from one direction to the other, with single-day trading ranges of 3% to 5%, we're content to remain fully in cash, preserving hard-earned profits. Doing so over the past several days has probably saved us a lot of money. Further, with the House of Representatives scheduled to vote on the $700 billion bailout package today, we must be prepared for anything. Maintaining a full cash position enables us to react quickly to take advantage of any new trends that suddenly develop.
Open ETF positions:
Long - (none)
Short - (none)
Deron Wagner is the Founder and Head Trader of both Morpheus Capital LP, a U.S. hedge fund, and Morpheus Trading Group, a trader education firm launched in 2001 that provides daily technical analysis of the leading ETFs and stocks. For a free trial to the full version of The Wagner Daily or to learn about Wagner's other services, visit MorpheusTrading.com or send an e-mail to deron@morpheustrading.com.
|