|
The Wagner Daily ETF Report For October 2
Stocks showed resilience yesterday, as the major indices moved lower in the morning, then reversed and recovered much of their early losses by mid-day. Relative weakness in tech stocks held the Nasdaq Composite down to a 1.1% loss, but the S&P 500 and Dow Jones Industrial Average declined just 0.3% and 0.2% respectively. Lagging alongside of the Nasdaq was the small-cap Russell 2000 and S&P Midcap 400 indices, both of which fell 1.2%. The main stock market indexes finished below their highs of the day, but around the upper third of their intraday ranges. Overall, it was positive that stocks maintained most of Tuesday's sharp gains.
Total volume in the NYSE declined 6% below the previous day's level, while volume in the Nasdaq eased 16%. Trading in the Nasdaq also dipped below its 50-day average level. Lower turnover for the second straight day was not shocking, as traders and investors are waiting for the House of Representatives to vote on the modified government financial bailout package. The latest update is the vote is expected to take place tomorrow (Friday) afternoon.
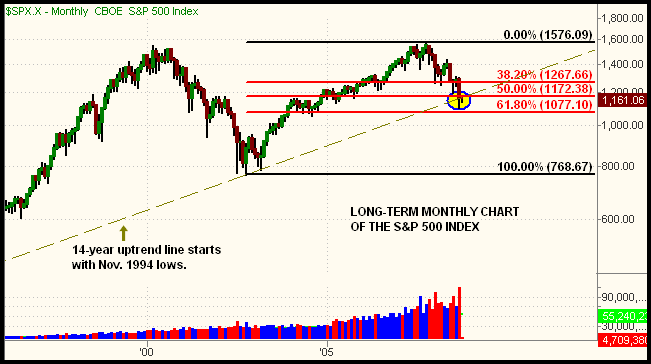
While waiting for the Fed vote that will likely have an impact on the short-term direction of the stock market, let's take an updated look at the long-term, monthly charts of the major indices. Occasionally analyzing the "big picture" is helpful in whippy, volatile markets, when the short-term trends are messy and unpredictable. We'll start with a "big picture" snapshot of the benchmark S&P 500:

Two weeks ago, we analyzed the monthly chart of the S&P 500, and not much has changed since then. At the time, we pointed out the key convergence of support that had formed at the 1,172 level. This was formed by both the 14-year uptrend line, which began with the low of November 1994, and the 50% Fibonacci retracement from the October 2002 low to the October 2007 high. The September 29 sell-off caused the S&P 500 to convincingly violate that convergence of support at the 1,172 level, but notice how the index quickly snapped back up to the same vicinity of support. Because we're looking at such a long-term time horizon, it's not a big deal that the S&P is technically sitting about 1% below the 1,172 support level. We can still say the index is near support of its 50% Fibonacci retracement and 14-year uptrend line. Nevertheless, if the S&P gives back much more of its September 30 gain in the coming days, we could expect bearish momentum to carry the index down to support of its 61.8% Fibonacci retracement, around the 1,077 level.
Since the 61.8% retracement level is considered to be the last decent chance of enabling dominant uptrends to continue, a convincing break below the 1,077 level would likely send the S&P 500 tumbling all the way back down to test its year 2002 lows. Such a big drop would undoubtedly be painful for long-term investors, but it's prudent to be prepared for that possibility, rather than burying one's head in the sand. Still, a plunge to the year 2002 lows is not really a big concern unless the S&P 500 fails to hold support of its 61.8% Fibonacci retracement level. Consider setting a price alert on that 1,077 level, so that you're instantly notified if that crucial level of support is violated. Next, take a look at the monthly chart of the Dow Jones Industrial Average:

Unlike the S&P 500, the Dow has already broken support of its 14-year uptrend line (not shown on the chart above). However, the index is still holding at key support of its 50% Fibonacci retracement (again from the October 2002 low to October 2007 high). The 9,871 area marks crucial support of the 61.8% Fibonacci retracement. As with the S&P 500, one could very realistically expect the Dow to fall all the way down to its year 2002 lows if the 61.8% retracement fails to hold up.
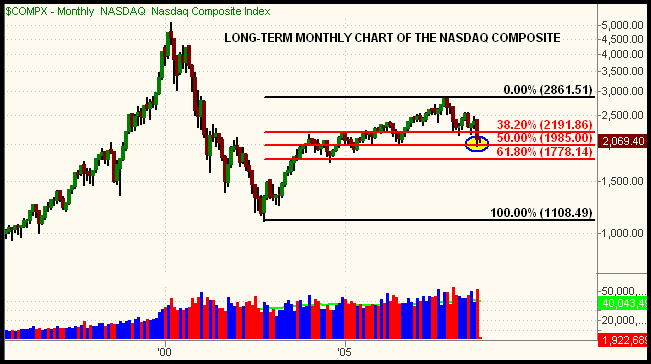
The Nasdaq Composite showed relative weakness yesterday, but the index is showing slight relative strength on its monthly chart:

The September 29 sell-off caused both the S&P and Dow to briefly probe below support of their 50% Fibonacci retracements, but notice how the Nasdaq never violated that level. Presently, the Nasdaq is sitting mid-way between its 38.2% and 50% Fibonacci retracement levels. The 61.8% Fibonacci retracement is at 1,768, 14.5% below the current price of the Nasdaq. Notice how the 61.8% retracement also coincides with support of the August 2004 low. This is not coincidence, as Fibonacci retracements frequently converge with major support of prior lows.
Analyzing the present short-term picture of the broad market is enough to give traders and investors a headache. But the long-term view gives much better clarity by smoothing out the spastic action of the past month. As short to intermediate-term traders, we don't directly base our trading decisions on the charts above. Nevertheless, it always helps to know the dominant, underlying trends of the broad market. In summary, we conclude the long-term trends are neutral, as long as the major indices hover around their 50% Fibonacci retracements. The direction of their next move in the coming months will determine whether that long-term neutral bias reverts back to bullish, or firmly bearish.
Open ETF positions:
Long - (none)
Short - (none)
Deron Wagner is the Founder and Head Trader of both Morpheus Capital LP, a U.S. hedge fund, and Morpheus Trading Group, a trader education firm launched in 2001 that provides daily technical analysis of the leading ETFs and stocks. For a free trial to the full version of The Wagner Daily or to learn about Wagner's other services, visit MorpheusTrading.com or send an e-mail to deron@morpheustrading.com.
|