|
The Wagner Daily ETF Report For September 24
As the U.S. Congress postured over the eventual terms of the Fed's financial bailout package yesterday, stocks hinged on every word, bobbing and weaving their way throughout the session. After drifting lower at mid-day, the major indices briefly recovered into positive territory later in the afternoon, but selling pressure in the final thirty minutes of trading shoved stocks back into the red. The Nasdaq Composite lost 1.2%, the Dow Jones Industrial Average 1.5%, and the S&P 500 1.6%. The small-cap Russell 2000 fell 1.6%, as the S&P Midcap 400 declined 1.2%. Considering the stock market's recent pattern of extremely wide intraday trading ranges, yesterday's session seemed relatively quiet. However, it was disappointing that the main stock market indexes again finished at their worst levels of the day.
Turnover was mixed. Total volume in the NYSE eased 22%, marking a second consecutive day of losses on lower volume, but volume in the Nasdaq rose 7%, causing the index to register a bearish "distribution day." In both exchanges, trading remained below 50-day average levels. Market internals were negative, but not as bad as the previous day's levels. Declining volume exceeded advancing volume by approximately 3 to 1 in both the NYSE and Nasdaq.
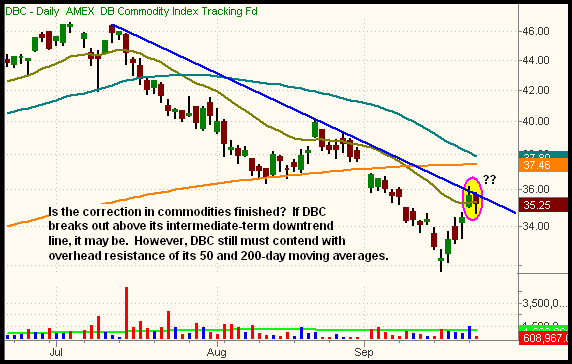
Commodities enjoyed a stellar period of gains from August 2007 through July 2008, then entered into an inevitable correction that has been in place for the past two months. But if you haven't checked out their chart patterns in a while, now is a good time to do so because the group is generally showing signs that the intermediate-term correction may soon be finished. To illustrate this, take a look at the daily chart of PowerShares DB Commodity Index Tracking Fund (DBC), which is comprised of a diverse variety of commodity index futures contracts:

Bearing little correlation to the major stock market indexes over the past week (a very good thing!), DBC has been trending steadily higher since bottoming on September 16. Over the past two days, while the broad market has been selling off, DBC has been holding in a tight, sideways range, right at its 20-day exponential moving average (the beige line). If DBC convincingly pops above its two-day high, it will represent a breakout above resistance of its downtrend line that began with the July 11 high. DBC still must contend with overhead resistance of both its 50 and 200-day moving averages, but a buy entry above its two-day high would provide a large enough profit buffer to quickly scratch the position if DBC fails its breakout attempt. Above all, the lack of correlation to the U.S. equities market is perhaps the most attractive element of this trade setup. For your information, the approximate composition of DBC is as follows: Crude Oil 37%, Heating Oil 23%, Corn 12%, Aluminum 10%, Wheat 10%, and Gold 8%.
Yesterday, the S&P 500, Nasdaq Composite, and Dow Jones Industrial Average all closed at support of their 61.8% Fibonacci retracement levels (measured from their lows of September 18 to their highs of September 19). Regarding a pullback within an uptrend, we refer to the 61.8% Fibonacci retracement level as the "last line of defense" because a violation of that support level frequently leads to a complete reversal back to the prior low. Nevertheless, as long as the 61.8% Fibonacci retracement levels hold up, stocks could still rapidly reverse back up to last week's highs within the next several days.
As per yesterday morning's commentary, we bought the Ultra Russell 2000 ProShares (UWM) on the market open. It's showing an unrealized loss at the moment, but is still above our stop loss. If the major indices hold yesterday's lows, and hence the vicinity of their 61.8% Fibonacci retracements, the trade still has a good chance of working out. But regardless of whether or not it does, we still like the original reason for entry -- the positive reward/risk ratio of buying the pullback to the 50% Fibonacci retracement, as well as support of the 50 and 200-day moving average convergence on the Russell 2000. Remember that profits can never be obtained without taking some degree of risk; we, as traders, get paid for taking calculated risks. With a portfolio that is still presently 80% cash, we're certainly comfortable with the risk of having just this one trade on the table.
Open ETF positions:
Long - UWM
Short - (none)
Deron Wagner is the Founder and Head Trader of both Morpheus Capital LP, a U.S. hedge fund, and Morpheus Trading Group, a trader education firm launched in 2001 that provides daily technical analysis of the leading ETFs and stocks. For a free trial to the full version of The Wagner Daily or to learn about Wagner's other services, visit MorpheusTrading.com or send an e-mail to deron@morpheustrading.com.
|