|
The Wagner Daily ETF Report For September 2
Stocks capped a lazy, choppy week of trading on a negative note, as traders sold stocks ahead of the holiday weekend. This caused the major indices to give back most, or all, of their previous day's gains. The Nasdaq Composite, which showed relative weakness in the preceding day's rally, suffered the most last Friday. The tech-heavy index fell 1.8%. The S&P 500 lost 1.4% and the Dow Jones Industrial Average dropped 1.5%. The small-cap Russell 2000 and S&P Midcap 400 registered matching losses of 1.1%. The main stock market indexes closed at, or near, their lowest levels of the day, positioning the broad market for bearish momentum to start the week. For the month of August, all the major indices managed to close higher. The S&P 500 gained 1.2%, the Dow Jones Industrial Average advanced 1.4%, and the Nasdaq Composite rallied 1.8%.
Not surprisingly, volume tapered off even more ahead of the Labor Day holiday. Total volume in the NYSE dwindled to 15% below the previous day's level, while volume in the Nasdaq receded 6%. Overall, last week's trading was extremely anemic. Aside from it being a seasonally slow week when traders and investors typically take annual vacations, both the bulls and bears laid low because the main stock market indexes are stuck in sideways trading ranges. How quiet was last week's trading activity? Investor's Business Daily reported last week's turnover as being the lightest since September of 1999. Hopefully, we'll see volume start to pick up as market participants begin returning to their desks this week. Decent volume levels are necessary for steady trends that we profit from.
In the August 29 issue of The Wagner Daily, we alerted subscribers that the August 28 rally was not as strong as it seemed. Specifically, we pointed out that leading stocks in the strongest sectors failed to exhibit relative strength, and the top-gaining industry sectors were merely those bouncing off their lows. We also cautioned that the Nasdaq had run into resistance of its 200-day moving average (MA), a level that caused trouble for the index the previous week. For these reasons, along with anticipated light volume, we were not shocked that stocks failed to hold their previous day's gains. Take an updated look at the daily chart of the Nasdaq Composite:
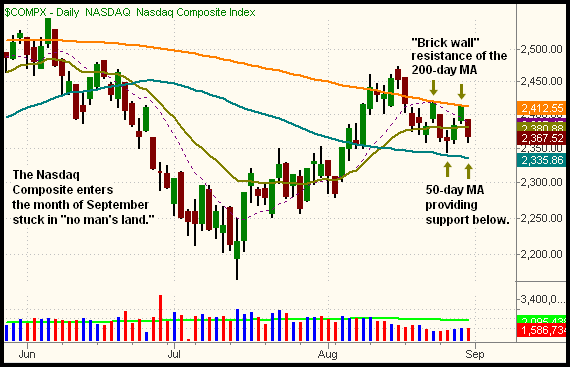
On August 11, the Nasdaq ran into its 200-day MA for the first time in months. After getting stuck at that level for a few days, the Nasdaq popped above it on August 14, but the rally turned out to be a "fakeout breakout." Two days later, the Nasdaq fell back below its 200-day MA. On August 22 (the first downward-facing arrow), the Nasdaq made another run at moving back above its 200-day MA, but failed to do so. Four days later, on August 28, the Nasdaq closed right at its 200-day MA, but that pivotal level of resistance again led to a sell-off the following day. This powerful "brick wall" support or resistance of the 200-day MA is discussed in my new book, Trading ETFs: Gaining An Edge With Technical Analysis.
With the 200-day MA acting as resistance overhead, but the 50-day MA providing support below, it's plain to see the Nasdaq enters the month of September in "no man's land." This leads to both good and bad news. The good news is that the near-term support and resistance levels of the Nasdaq Composite are glaringly obvious. The bad news is that we don't know how long it will take until we resolution in either direction. As technical traders, we can profit equally from a clear market move in either direction, but the most challenging markets are always the low volatility, range-bound ones.
When daily charts are choppy, it's best to scale out to the longer-term weekly charts, which enable traders to more easily see "the big picture" by eliminating much of the noise on the shorter-term daily charts. So, let's take a look at the weekly chart of the Nasdaq Composite:
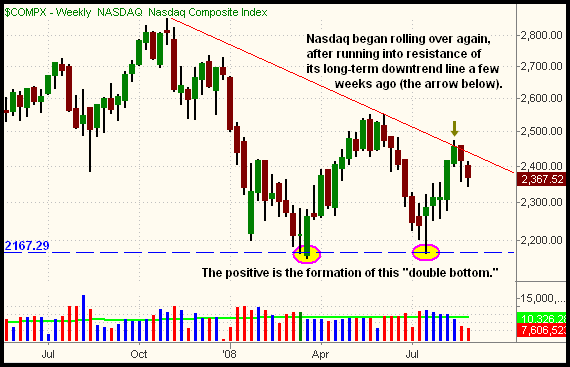
There are two notable formations on the weekly chart above. First, it's bullish that the Nasdaq Composite formed a "double bottom" formation in July 2008, which roughly matched the lows of March 2008. The dashed, blue horizontal line illustrates this. Unfortunately, however, the long-term downtrend line (the red descending line) is countering the bullishness of the "double bottom." Since forming a peak in November of 2007, the Nasdaq has been in a dominant, primary downtrend. Rallies along the way have merely been counter-trend bounces. Notice how the Nasdaq has begun moving lower again, after running into resistance of its primary downtrend line three weeks ago.
Until the Nasdaq proves otherwise by breaking out above its long-term downtrend line, we have no choice but to assume the well-established bearish trend will continue to prevail. Obviously, a confirmed rally above the mid-August high would be decidedly bullish, but there's no point discussing that scenario until it happens. As professional traders, we always trade what we see, not what we think! For now, we see lots of choppy, range-bound patterns in the short to intermediate-term, but the dominant "big picture" trends remain bearish. Don't lose perspective of that.
Because last week's action was so slow, we've been discussing chart patterns of the main stock market indexes more than specific sectors and ETFs over the past few days. But as volume starts returning to the markets this week, new ETFs with relative strength and weakness on their chart patterns should start to emerge. As always, we'll be on top of those new sector trading opportunities and reporting them to you, regardless of which direction the broad market breaks in the short-term. For now, we'll just focus on managing our minimally exposed ETF portfolio of only two positions (long TAN, long IYH).
Open ETF positions:
Long - TAN, IYH
Short -
Deron Wagner is the Founder and Head Trader of both Morpheus Capital LP, a U.S. hedge fund, and Morpheus Trading Group, a trader education firm launched in 2001 that provides daily technical analysis of the leading ETFs and stocks. For a free trial to the full version of The Wagner Daily or to learn about Wagner's other services, visit MorpheusTrading.com or send an e-mail to deron@morpheustrading.com.
|


 Free Festival of Traders Videos