| The Wagner Daily ETF Report For August 28 |
| By Deron Wagner |
Published
08/28/2008
|
Stocks
|
Unrated
|
|
|
|
The Wagner Daily ETF Report For August 28
Biding their time ahead of the Labor Day holiday, stocks stubbornly grinded their way higher yesterday, enabling the major indices to close with moderate gains. The Nasdaq Composite rallied 0.9%, as the S&P 500 and Dow Jones Industrial Average scored matching gains of 0.8%. Relative strength in small and mid-caps helped the Russell 2000 and S&P Midcap 400 to register identical advances of 1.3%. Showing indecision in the final hour, the main stock market indexes finished just in the upper third of their intraday ranges.
As anticipated, turnover remained light. Total volume in the NYSE receded 3% below the previous day's level, while volume in the Nasdaq ticked 7% higher. Though the Nasdaq technically registered a bullish "accumulation day" by advancing on higher volume, it would be deceiving to say yesterday's gains were driven by institutional buying. This is because volume remained well below its 50-day average level, just as it has been for more than two weeks. As we approach the three-day holiday weekend, trading may slow to a crawl, but the good news is that volume should begin returning to average levels next week. When it does, you'll find overall trading conditions, especially trends, will improve as well.
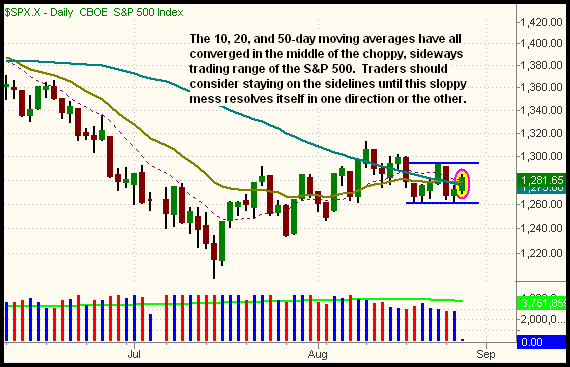
At the beginning of the week, we said, "As we enter one of the traditionally slowest weeks of the year, the main stock market indexes continue to exhibit mixed signals. The Nasdaq Composite bounced off support of its intermediate-term uptrend line last week, but now must contend with resistance of its 200-day MA. It's positive that the S&P 500 and Dow Jones Industrial Average both reclaimed their 20 and 50-day moving averages, but a lot of overhead supply remains from earlier in the month. With the major indices essentially in "no man's land," expect continued chop and whippy price action." Throughout the first three days of the week, that's exactly what we've experienced so far. Take an updated look at the daily chart of the S&P 500:

The two blue horizontal lines on the chart above mark the short-term support and resistance levels of the S&P 500. Notice how the 10-day moving average (the dotted line), 20-day exponential moving average (the beige line), and 50-day moving average (the teal line) have all converged in the middle of that horizontal channel. This clearly illustrates why we say the index is in "no man's land." In the near-term, the broad market could easily snap in either direction, depending on whether the bulls or bears win the current tug-of-war. But it's a losing proposition to trade the market as long as the S&P remains in this sideways range. The daily chart of the Dow Jones Industrial Average looks very similar to the pattern of the S&P 500:

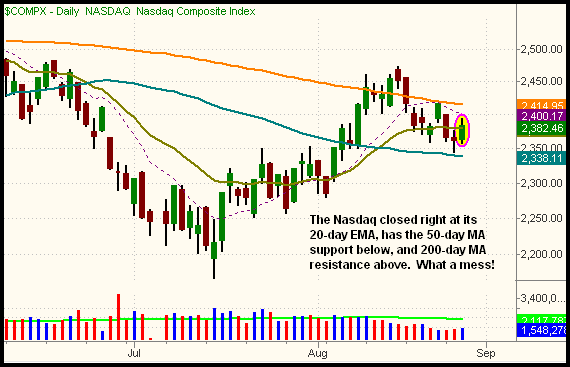
Is the pattern of the Nasdaq Composite looking any better? Not at all. The Nasdaq closed right at its 20-day EMA, is sitting above support of its 50-day MA, and below resistance of its 200-day MA. Nice slope:

Based on the chart patterns above, you can see why we've been saying there's no need to worry about entering new positions until the major indices make a decisive break in one direction or the other. We know from past experience that chart patterns like these, combined with much lower than average overall market volume, is a recipe for overtrading and churning one's account. As an individual investor/trader, you have one major advantage over institutions -- the ability to stay on the sidelines until conditions improve. Most mutual funds, on the other hand, have bylaws that force them to be fully invested at all times. Take advantage of that edge you have by patiently waiting for the market to clearly show its hand. When it does, you'll be fresh and ready to make a move in whichever direction it breaks. Again, this will probably not happen until sometime next week, when traders and investors start snapping out of vacation mode.
Open ETF positions:
Long - DXD, TAN, IYH
Short - (none, but DXD is a bearish position)
Deron Wagner is the Founder and Head Trader of both Morpheus Capital LP, a U.S. hedge fund, and Morpheus Trading Group, a trader education firm launched in 2001 that provides daily technical analysis of the leading ETFs and stocks. For a free trial to the full version of The Wagner Daily or to learn about Wagner's other services, visit MorpheusTrading.com or send an e-mail to deron@morpheustrading.com.
|