| The Wagner Daily ETF Report For August 27 |
| By Deron Wagner |
Published
08/27/2008
|
Stocks
|
Unrated
|
|
|
|
The Wagner Daily ETF Report For August 27
Stocks bobbed and weaved through a lackluster session yesterday, as the main stock market indexes finished with mixed results. The S&P 500 gained 0.4% and the Dow Jones Industrial Average advanced 0.2%, but the Nasdaq Composite slipped 0.2%. The small-cap Russell 2000 and S&P Midcap 400 indices were higher by 0.4% and 0.5% respectively. After dipping below their previous day's lows in the afternoon, the major indices recovered to close just above the middle of their intraday ranges.
Total volume in the NYSE was on par with the previous day's level, while volume in the Nasdaq ticked 3% higher. Turnover in both exchanges, of course, remained well below average levels. It has been nearly three weeks since trading in the NYSE exceeded its 50-day average mark. Market internals were mixed. In the NYSE, advancing volume edged out declining volume by 3 to 2. The Nasdaq adv/dec volume ratio was marginally negative.
After the close of trading, we scanned through the charts of hundreds of ETFs. An overwhelming majority of them have chart patterns that place their current prices in "no man's land," just like the daily charts of the broad-based indexes. The various healthcare ETFs, including tickers such as IHI, IYH, IBB, XBI, and BBH, continue to show the most relative strength of all industries. Though they have retraced from their recent highs, most are holding in a tight range of support at or near their 20-day exponential moving averages (EMAs). If we were not already long two ETFs in this sector (IYH and IBB), we would be looking to moderately buy the healthcare ETFs on this healthy pullback from their highs. Buying leading sector ETFs on pullbacks to their 20-day EMAs is consistently a profitable play that yields a positive reward/risk ratio.
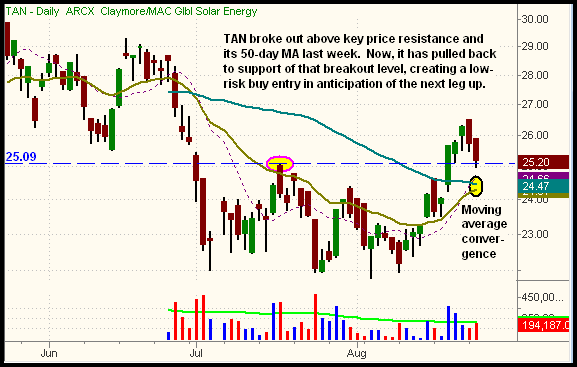
Another ETF to consider for potential long entry is Claymore Global Solar Energy (TAN). The solar energy sector woke up last week, as leading individual stocks broke out above key areas of resistance. This caused TAN to break out above both its 50-day moving average and prior "swing high" on August 20. Since then, we've been patiently waiting for TAN to pull back to new support of its breakout level. That pullback came yesterday. Take a look:

The dashed horizontal line on the chart above marks the prior high from July 17 (circled in pink). This is the area of resistance that TAN broke out above on August 20, which should now act as support on this retracement from its recent high. Circled in black, notice how the 10, 20, and 50-day moving averages are also converging below, which will provide additional support if TAN pulls back any further. As such, we think an entry into TAN near its current price provides a positive reward/risk ratio that will effectively position traders to catch the next leg up in the bullishly reversing solar sector. Regular subscribers to The Wagner Daily should note our detailed trigger, stop, and target prices for this setup below.
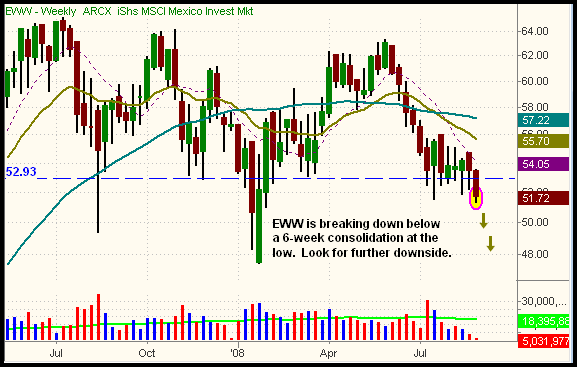
For those looking for a short setup with little correlation to the main stock market indexes, iShares Mexico (EWW), an international ETF, just broke down below a six-week consolidation at the lows to close at a new seven-month low. A few weeks ago, we pointed out EWW as a potential short sale if it broke down below the low of its short-term consolidation. Following it in the background, it continued to consolidate and chop around at its lows for several more weeks, but now it looks as though it's about to make another leg down. The breakdown is illustrated on the weekly chart below. At the least, we expect a test of the January 2008 low, around the $47.50 area:

Yesterday's action did not change the technical picture of the broad market. As illustrated in yesterday's commentary, the S&P 500 is clinging to support of its "swing low" from last week. If it breaks down to close below that 1,261 level, expect to see a surge of downside momentum because the short and intermediate-term trends would swing to bearish. Nevertheless, the stock market is in vacation mode through the rest of this week. Though there may be a "fakeout" or two in the coming days, don't expect to see the real direction of the market's next move until traders and investors begin returning to their desks after the Labor Day holiday.
Open ETF positions:
Long - DXD, IYH, IBB
Short - (none, but DXD is a bearish position)
Deron Wagner is the Founder and Head Trader of both Morpheus Capital LP, a U.S. hedge fund, and Morpheus Trading Group, a trader education firm launched in 2001 that provides daily technical analysis of the leading ETFs and stocks. For a free trial to the full version of The Wagner Daily or to learn about Wagner's other services, visit MorpheusTrading.com or send an e-mail to deron@morpheustrading.com.
|