|
The Wagner Daily ETF Report For August 22
Stocks oscillated sideways to slightly higher range through another lackadaisical session yesterday, causing the major indices to finish with mixed results. The S&P 500 advanced 0.3% and the Dow Jones Industrial Average eked out a gain of 0.1%, but the Nasdaq Composite fell 0.4%. Even small and mid-cap stocks showed divergence. The Russell 2000 lost 0.9%, as the S&P Midcap 400 ticked 0.1% higher. With the exception of the Russell 2000, all the main stock market indexes finished in the upper third of their intraday trading ranges.
Seasonal summertime "blahs" caused turnover to fall to its lowest levels in months. Total volume in the NYSE eased 14% below the previous day's level, while volume in the Nasdaq declined 11%. It's been more than two weeks since volume in the NYSE even exceeded its 50-day average level, but that's not unusual for this time of year. After the Labor Day holiday, expect trading to start picking up again.
In the August 19 issue of The Wagner Daily, we illustrated how the SPDR Gold Trust (GLD) had pulled back to support of its long-term, multi-year uptrend line. Specifically, we said, "If you've been looking for a low-risk place to buy some gold for your long-term account, such as an IRA or 401k, an entry into GLD at current levels makes sense." We did, however, caution that the atrocious sell-off over the past month meant that GLD was not ideal for a short-term play. Let's take a look at how GLD has performed since our heads-up for a potential buy entry. The first chart below is of the long-term monthly time frame, while the second chart presents a more detailed look of the weekly time frame.
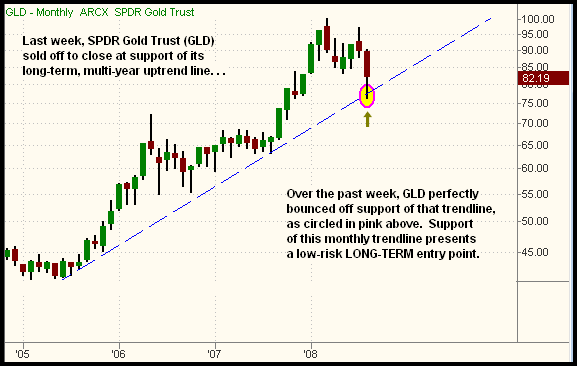
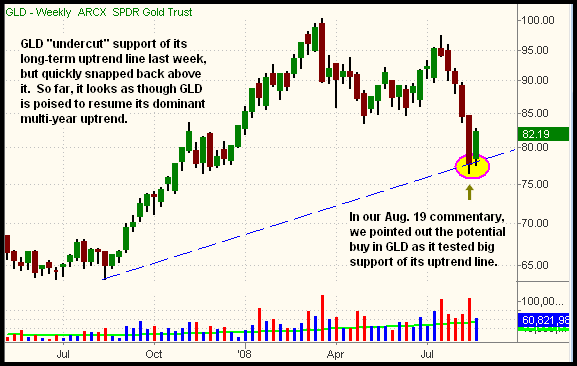
On the weekly chart (the second one), notice how GLD perfectly bounced off support of its multi-year uptrend line this week. GLD actually probed a few cents below support of its primary uptrend line last week, but it's normal for stocks and ETFs to briefly dip below obvious levels of support before stabilizing (known as an "undercut"). That's the same manner in which we recently grabbed a low-risk entry point into UltraShort Financials ProShares (SKF) when it "undercut" its 200-day moving average (we sold a few days later for a gain of approx. + 20 points).
The broad healthcare sector, including biotech, pharmaceutical, and medical devices, was the leading sector throughout the broad market rally from the middle of last month to the middle of this month. Over the past several days, healthcare has been correcting by selling off down to key support levels, but the recent retracement now presents a buying opportunity for traders and investors who might have missed the initial thrust higher in the various healthcare ETFs. Many healthcare ETFs are now poised to resume their intermediate-term uptrends. The daily chart of iShares Healthcare Sector Index (IYH) is an example of this:
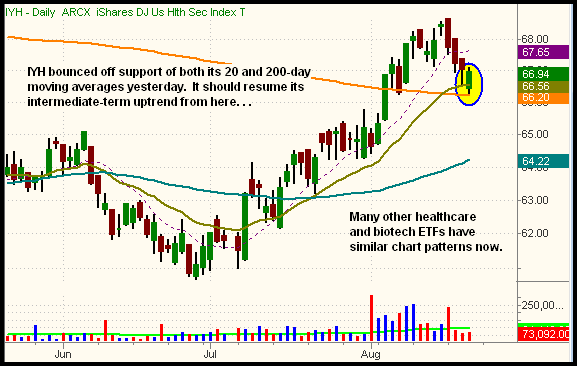
Notice how IYH bounced off support of its 20-day exponential moving average, just as it came into new support of its 200-day moving average (the thick orange line). This is how strong and healthy stocks and ETFs typically perform -- they rally, pullback to 20-day EMA, rally to set a "higher high," then pullback to 20-day EMA again, forming a "higher low," before rallying to set another "higher high." If you're not already positioned in the healthcare sector, you might consider doing so on this pullback. We expect most of the healthcare ETFs to zoom to new highs in over the next several weeks.
Here's a little something to think about. Take a look at the following short-term, hourly chart pattern of an ETF, and determine which direction you think the next move is likely to go:
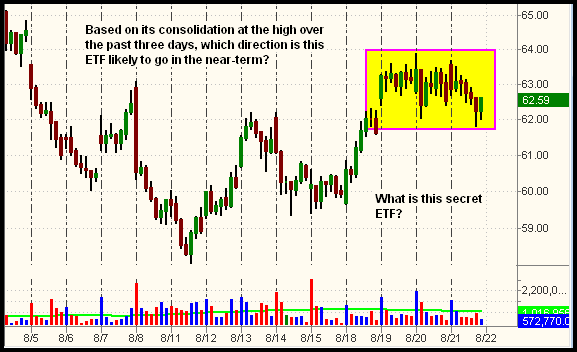
If you said "higher," we agree with you. After making a significant, upward move in a short period of time, stocks and ETFs will often consolidate in a tight, sideways range before breaking out to a new high. That's exactly what's happening on the chart above. The big question, however, is which ETF is shown above? It is an hourly chart of the UltraShort Dow 30 ProShares (DXD), which we bought on August 14. Since the UltraShort family of ETFs moves in the opposite direction of the underlying index, that means the Dow is now consolidating at its recent low (or recent high for the UltraShort ETF). Obviously, this is bearish for the Dow. Based on the patterns of both DXD and SDS (UltraShort S&P 500 ProShares) looking the same, it looks as though the next move in the broad market will be lower. Nevertheless, both the leading Russell 2000 and Nasdaq Composite indexes are at key support levels. As such, we continue to maintain a mixed portfolio of ETF positions, but with a light overall exposure to the market.
Open ETF positions:
Long - IYH, IBB, DXD
Short - (none, but DXD is a bearish position)
Deron Wagner is the Founder and Head Trader of both Morpheus Capital LP, a U.S. hedge fund, and Morpheus Trading Group, a trader education firm launched in 2001 that provides daily technical analysis of the leading ETFs and stocks. For a free trial to the full version of The Wagner Daily or to learn about Wagner's other services, visit MorpheusTrading.com or send an e-mail to deron@morpheustrading.com.
|


 Free Festival of Traders Videos