|
The Wagner Daily ETF Report For August 20
Stocks moved lower for a second straight day yesterday, as several of the main stock market indexes broke below key support levels. Unlike the previous day, in which the broad market trended steadily lower throughout the entire session, most of yesterday's losses occurred in the morning. Thereafter, stocks oscillated in a choppy, sideways range throughout the rest of the day. The S&P 500 fell 0.9%, the Dow Jones Industrial Average 1.1%, and the Nasdaq Composite 1.4%. The small-cap Russell 2000 and S&P Midcap 400 indices were lower by 1.6% and 1.0% respectively. All the major indices closed in the bottom third of their intraday ranges, but that didn't mean much considering the relatively tight trading ranges of the afternoon.
Turnover rose across the board yesterday, causing both the S&P 500 and Nasdaq Composite to register a "distribution day" that was indicative of institutional selling. Total volume in the NYSE rose 5% above the previous day's level, while volume in the Nasdaq similarly ticked 4% higher. Considering that Monday's lackadaisical trading pace was the slowest in months, it was not surprising that volume increased a bit yesterday. In both the NYSE and Nasdaq, declining volume exceeded advancing volume by a margin of approximately 4 to 1.
While noting the relative strength of the broad retail sector last week, we specifically pointed out the bullish chart pattern of the S&P Consumer Staples SPDR Fund (XLP), which had broken out above major resistance of its June 2008 high. Although we felt XLP was one of the better looking ETFs in this uninspiring environment, we wanted to wait for a pullback to support before buying. I want to give you a "heads up" that that anticipated pullback is happening right now, creating a low-risk buy entry in XLP at the moment. Take a look at the weekly chart of XLP below:

Notice how XLP has retraced down to the vicinity of last week's breakout, as noted by the dashed horizontal line on the chart above. Remember that the most basic tenet of technical analysis states a prior area of resistance becomes the new support, after the resistance is broken. This means that the breakout above horizontal price resistance of the June 2008 highs should now act as key support on any pullback in XLP. As such, the current retracement presents a low-risk buy entry with a positive reward/risk ratio. Aside from the healthcare ETFs, many of which pulled back to support of their 20-day exponential moving averages yesterday, retail is one of the strongest looking sectors lately.
Taking an updated look at the technical picture of the broad market, some significant events took place yesterday. The negative is that both the S&P 500 and Dow Jones Industrial Average sliced below support of their intermediate-term uptrend lines, which began with the lows of last month. The positive, however, is that both the leading Russell 2000 and Nasdaq Composite indexes pulled back to touch support of their 20-day exponential moving averages (EMAs). Below is a daily chart of the Nasdaq Composite. Notice how support of its 20-day EMA converges with support of its intermediate-term uptrend line from the July 2008 low:
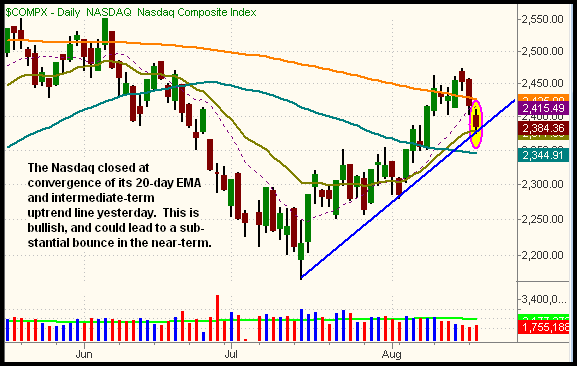
Several days ago, we pointed out that the Nasdaq Composite had rallied into resistance of its weekly downtrend line, which was likely to trigger a pullback in the broad market. That's exactly what has happened over the past two days. However, the Nasdaq has now corrected down to support of both its 20-day EMA and intermediate-term uptrend line. This, of course, is bullish in the near-term. But wait, don't get too excited, the broad-based S&P 500 just complicated the picture by falling below support of its 20-day EMA and intermediate-term uptrend line yesterday. Take a look:
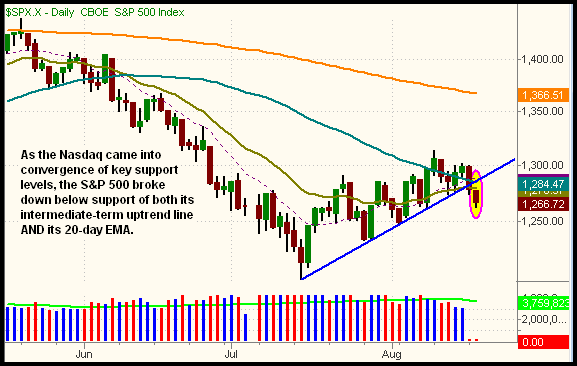
With the Nasdaq Composite and Russell 2000 (not illustrated) coming into key areas of short-term support, but the S&P 500 and Dow Jones Industrial Average (not illustrated) breaking down below their key short-term support levels, it's fair to say the main stock market indexes are now showing mixed signals and out of sync with one another. So, which signal will hold the most weight? Since we're talking about an uptrend, the index(es) that led the way higher over the past month should have the most bearing on the near-term direction of the broad market. Those indexes were the Nasdaq Composite and Russell 2000. With support of their 20-day EMAs below (and the intermediate-term uptrend for the Nasdaq Composite), there's a good chance these indexes will cause the market to show moderate strength in the coming days. Still, a break below yesterday's lows in any of the broad-based indexes, especially the Nasdaq and Russell 2000, could weigh heavily on the broad market.
After buying the rally off its 200-day MA last week, we closed our position in UltraShort Financials ProShares (SKF) yesterday, locking in a handsome gain of 19 points (16.5%). Although we still expect the banking and broker/dealer sectors to eventually test last month's lows, we are not interested in holding through a pullback in SKF if strength in the Nasdaq/Russell causes the sector to bounce in the short-term. Rather, we'll look for SKF to consolidate for a week or so, then plan to re-enter the position on any subsequent breakout above the range of the consolidation (as well as the 50-day MA). We secured a nice profit in SKF, but still have a bearish position on the broad market through UltraShort Dow 30 ProShares (DXD), which is now showing a healthy unrealized profit as well. Our long positions in iShares Healthcare (IYH) and iShares Nasdaq Biotech (IBB) also remain intact. IBB came into support of its 20-day EMA yesterday. IYH is still firmly above its 20-day EMA.
Open ETF positions:
Long - IYH, IBB, DXD
Short - (none, but DXD is a bearish position)
Deron Wagner is the Founder and Head Trader of both Morpheus Capital LP, a U.S. hedge fund, and Morpheus Trading Group, a trader education firm launched in 2001 that provides daily technical analysis of the leading ETFs and stocks. For a free trial to the full version of The Wagner Daily or to learn about Wagner's other services, visit MorpheusTrading.com or send an e-mail to deron@morpheustrading.com.
|


 Free Festival of Traders Videos