|
The Wagner Daily ETF Report For August 15
After gapping lower on the open, the major indices quickly reversed into the plus column. Stocks continued their advance through mid-day, but afternoon weakness again caused stocks to surrender a chunk of their intraday gains. Nevertheless, each of the main stock market indexes finished with a respectable gain. The Nasdaq Composite climbed 1.0%, the Dow Jones Industrial Average 0.7%, and the S&P 500 0.6%. The small-cap Russell 2000 and S&P Midcap 400 indices rallied 0.9% and 0.8% respectively. The S&P 500 and Dow Jones Industrial Average closed just above the middle of their intraday ranges, as the Nasdaq Composite settled just off its best level of the day.
The key ingredient missing from yesterday's session was higher turnover. Total volume in the NYSE decreased by 16%, while volume in the Nasdaq came in 8% below the previous day's level. Unfortunately, a lighter volume day of gains that follows a higher volume day of losses is exactly the opposite of what the bulls want to see. Furthermore, volume in both exchanges limped in at its lightest levels in weeks or more. If institutions remain more active on the "down" days than the "up" days, the stock market will eventually succumb to the selling pressure. This is because mutual funds, hedge funds, pension funds, and other institutions represent well over 50% of the market's total volume on an average day. Detecting changes in the market's volume patterns, in relation to prices, is one of the most reliable ways to know the true strength or weakness of a market. Recently, the overall price to volume relationship of the broad market has turned negative. This may contradict the modestly bullish bias of the market, but volume is typically a leading indicator of market direction, not a lagging one.
Over the past week, we've analyzed chart patterns of various sector ETFs we liked for entry on both sides of the market. Today, we're going to take an updated look at the chart patterns of the main stock market indexes. We'll begin by analyzing the daily chart of the benchmark S&P 500:
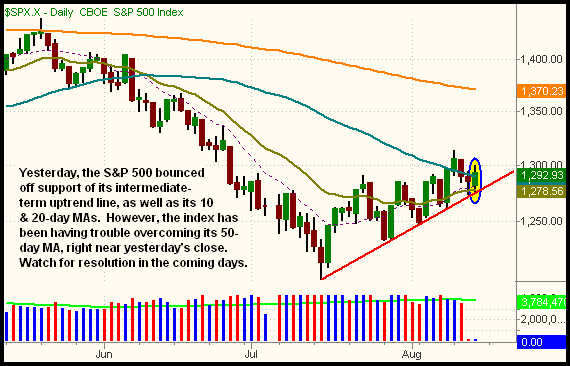
The intermediate-term uptrend line that began with the July 15 low can clearly be seen (the ascending red line that connects the "swing lows"). Interestingly, both the 10-day moving average (the dotted line) and 20-day exponential moving average (the beige line) have converged at support of that uptrend line as well. This is important to note because the convergence of support corresponds with yesterday's low in the S&P 500. If this major area of support holds up, as it has in recent weeks, the S&P 500 could soon push to a new "swing high," above the Aug. 11 high of 1,313. The challenge is that the 50-day MA (the teal line) has been holding the index down. Surely, a high volume wave of buying could generate the necessary momentum for the S&P 500 to convincingly blast through its 50-day MA and on to a new "swing high." However, if the S&P 500 sees just a bit of selling pressure that causes it to close firmly below yesterday's low of 1,276, the index will have broken down below major support of its one-month uptrend line, its 10-day MA, and 20-day EMA. Such price action would definitely change our near and intermediate-term biases to a decidedly more bearish stance. But until the S&P 500 either blasts through its 50-day MA, or falls below trendline and moving average support, we have a neutral, to just slightly bullish, bias that will allow us to quickly make the jump in either direction.
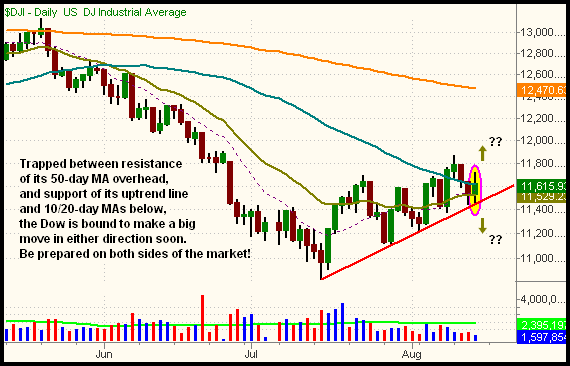
The blue-chip Dow Jones Industrial Average has a very similar daily chart pattern.. Like the S&P 500, yesterday's low converges with support of its intermediate-term uptrend line, while its 10-day MA and 20-day EMA are right at yesterday's opening price. The 50-day MA is right where the Dow closed yesterday. This is annotated below:
Of the "big three" main stock market indexes, the Nasdaq Composite has been showing the most relative strength since the mid-July bottom. As such, it's not surprising the Nasdaq also has the most bullish daily chart pattern. The S&P 500 and Dow Jones Industrial Average have matching chart patterns, but the daily chart of the Nasdaq Composite clearly looks better than both the S&P and Dow:
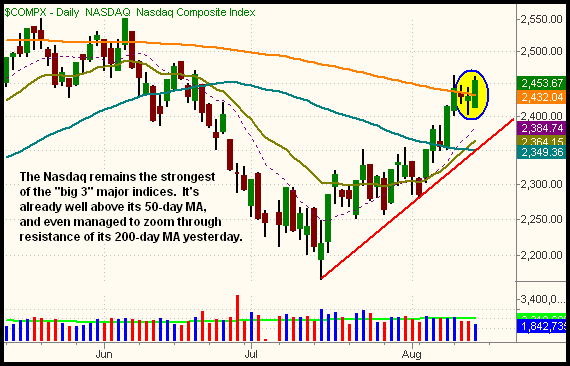
Notice that the Nasdaq is already well above its 50-day moving average. The 20-day exponential moving average has also crossed up through the 50-day moving average, which is a bullish signal. There is an intermediate-term uptrend line, which has converged with the 50-day moving average, but the Nasdaq is trading well above it. Yesterday, the Nasdaq even closed above its 200-day moving average, after consolidating at that level for a few days. Although the index is still more than 14% below its 52-week high, set in November of 2007, the Nasdaq is fast approaching resistance of its June 2008 highs. A rally above that wall of resistance would definitely increase investor confidence.
As we close the week, both the S&P 500 and Dow Jones Industrial Average are in "no man's land," trapped between key levels of support and resistance. Expect the indexes to resolve their trends in either direction within the next several days. If long the market, realize the Nasdaq has a better chance of going higher than the S&P and Dow. Biotech, software, and semiconductor sectors are all looking good, though biotech is clearly the strongest sector of the three. If the S&P and Dow crack support shown above, the Nasdaq may have a difficult time going much higher. In that scenario, we would opt for selling short the S&P and/or Dow ETFs, rather than buying new positions in the Nasdaq. A convincing break of yesterday's low would pique our interest for further positions on the short side of the market, but we're not interested in any new short positions until that happens.
Open ETF positions:
Long - IYH, IBB, SKF
Short - (none, but SKF is a bearish position)
Deron Wagner is the Founder and Head Trader of both Morpheus Capital LP, a U.S. hedge fund, and Morpheus Trading Group, a trader education firm launched in 2001 that provides daily technical analysis of the leading ETFs and stocks. For a free trial to the full version of The Wagner Daily or to learn about Wagner's other services, visit MorpheusTrading.com or send an e-mail to deron@morpheustrading.com.
|


 Free Festival of Traders Videos