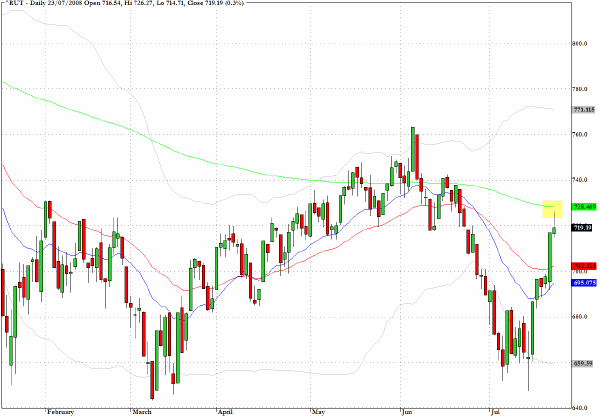
Shooting star candlesticks are starting to appear on some of the key US indices and sector funds suggesting that the recent rally is running into some overhead supply. The intermediate term target for the Russell 2000 (^RUT) is 740 but there is chart resistance between 720 and 740.
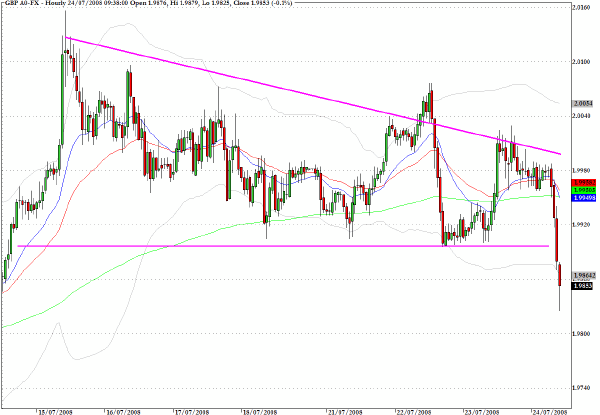
The Euro continues its descent in European trading on Thursday morning as it failed to mount a snap back rally during yesterday's session. Targets below $1.56 are now realizable this week but the main story this morning is the drop of the British pound. It is notably weaker on all the significant cross rates, particularly against the Euro but also against the dollar.
The proximate fundamental factor cited is a very weak retail sales report released Thursday morning, but the hourly chart below of the GBP/USD cross rate shows a technically bearish pattern. As dollar strength seems to be gathering momentum the longer term forecast for sterling against the dollar could see rates moving back towards $1.85.
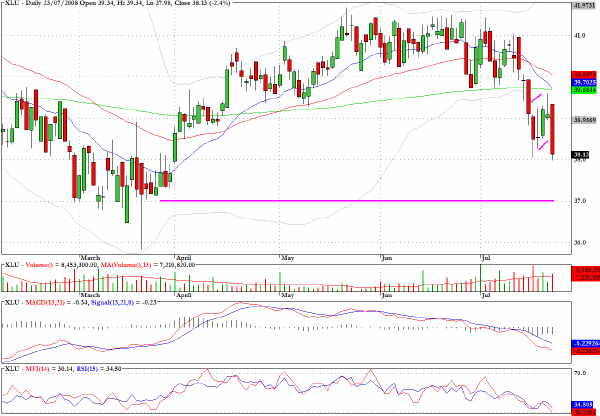
As anticipated in Monday's column the Dow Jones Utilities (^DJU) is vulnerable as long term interest rates continue to move higher. Discussed below is an ETF that provides exposure on the short side to the sector.
The chart for XLU illustrates the mini bear flag pattern that preceded yesterday's 2.4% drop and a price target of $37 is feasible in coming sessions.
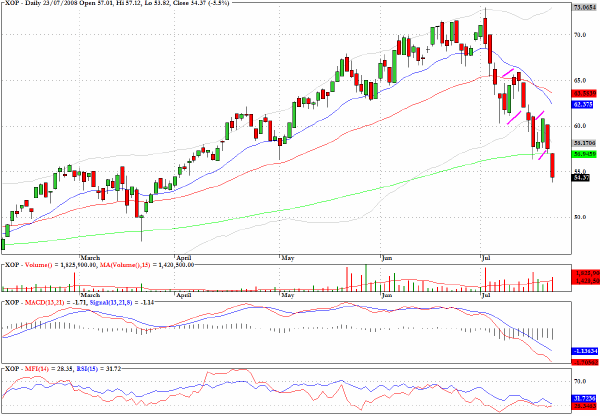
XOP, the exchange traded fund that tracks oil and gas exploration has performed well on the short side since my recent recommendation. A downward staircase/waterfall pattern is now manifesting itself which indicates broad based distribution.
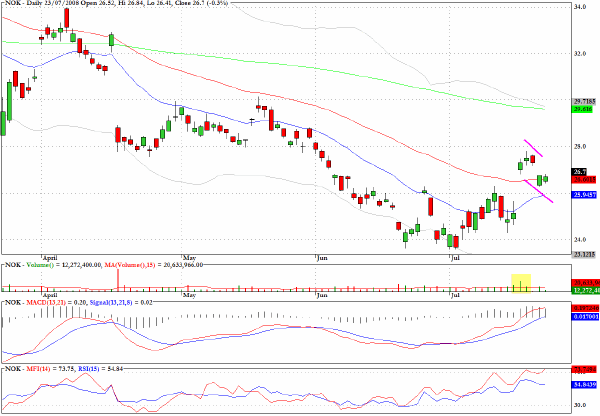
Nokia (NOK) has retreated to potential support since the large upward gap move on July 17 and the volume on the pullback has been subdued.
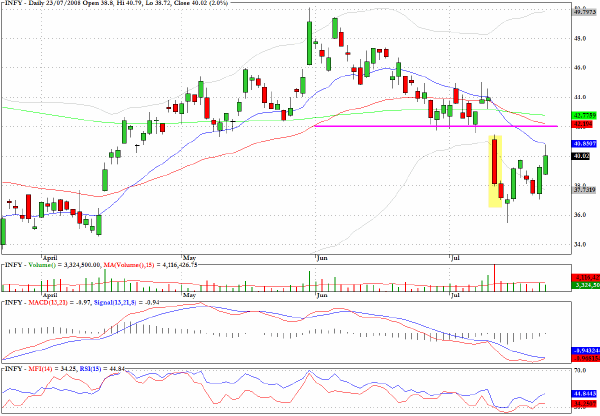
Infosys Technologies (INFY) looks vulnerable and short entry opportunities above $42 would be worth considering.
Clive Corcoran is the publisher of TradeWithForm.com, which provides daily analysis and commentary on the US stock market. He specializes in market neutral investing and and is currently working on a book about the benefits of trading with long/short strategies, which is scheduled for publication later this year.
Disclaimer The purpose of this article is to offer you the chance to review the trading methodology, risk reduction strategies and portfolio construction techniques described at tradewithform.com. There is no guarantee that the trading strategies advocated will be profitable. Moreover, there is a risk that following these strategies will lead to loss of capital. Past results are no guarantee of future results. Trading stocks and CFD's can yield large rewards, but also has large potential risks. Trading with leverage can be especially risky. You should be fully aware of the risks of trading in the capital markets. You are strongly advised not to trade with capital.
Copyright 2026 Tiger Shark Publishing LLC . All rights reserved.
It should not be assumed that the methods, techniques, or indicators presented on these websites will be profitable or that they will not result in losses. Past results are not necessarily indicative of future results. Examples presented on these websites are for educational purposes only. These set-ups are not solicitations of any order to buy or sell. The authors, Tiger Shark Publishing LLC, and all affiliates assume no responsibility for your trading results. There is a high degree of risk in trading.


 Free Festival of Traders Videos