|
The Wagner Daily ETF Report For July 24
Stocks followed through on momentum of the previous day's rally yesterday, but the bulls took a rest in the afternoon, causing the major indices to give back about half of their intraday gains. Nevertheless, the Nasdaq Composite still tacked on another 1.0% gain. The S&P 500 advanced 0.4% and the Dow Jones Industrial Average climbed 0.3%. The small-cap Russell 2000 and S&P Midcap 400 gained 0.3% and 0.1% respectively. Each of the main stock market indexes finished near the middle of the day's range.
One very positive element of yesterday's session is that stocks managed to register another bullish "accumulation day" by rallying on higher volume. Total volume in the NYSE increased 9% over the previous day's level, while volume in the Nasdaq rose 6%. In yesterday's commentary, we discussed the bullish price to volume relationship stocks have been exhibiting over the past week, and yesterday's "accumulation day" continued to build on that. Mutual funds, hedge funds, pension funds, and other institutions have been showing a healthy appetite for stocks, a necessary element in order for the current rally off the July lows to be sustainable. The only possible downside is that market internals were not very impressive. In both exchanges, advancing volume exceeded declining volume by a ratio of less than 2 to 1.
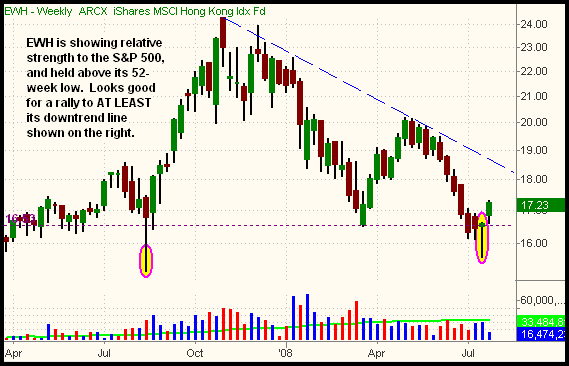
As the domestic stock market has begun finding some legs, we've been scanning through charts of the numerous international ETFs for buying opportunities as well. Last week, we liked the setup in Market Vectors Russia (RSX), which had corrected down to major support of both its 200-day moving average and its long-term uptrend line. On July 17, RSX gapped up to break out of its base of consolidation, triggering our buy entry. Unfortunately, however, the breakout failed and RSX fell to new lows as the domestic markets moved higher. Though we clearly had good reasons for buying at the time, we closed the position for a loss because it is now showing way too much relative weakness. But on the upside, we now like the pattern and price action in iShares Hong Kong (EWH), which we bought on July 22. Below is a snapshot of its long-term weekly chart (moving averages have been removed for better clarity of the pattern):

Not surprisingly, EWH trended lower from May through July, alongside of the main stock market indexes. It undercut its May 2008 low in the process, but notice that it never traded down to a new 52-week low. Because last year's rally was more gradual than that of the S&P 500 and Dow Jones Industrial Average, it held above its prior low from last August. Last week, EWH "undercut" its recent lows throughout the week, but rallied to finish the week positive, forming a bullish "hammer" candlestick in the process. So far this week, it never violated any of last week's range, and is poised to score another week of gains. The S&P 500 is also on track for another week of gains, but it retraced a bit of last week's gains on Monday and Tuesday.
Over the past three days, EWH has rallied 3.9%. Comparatively, the S&P 500 has gained just 1.7%. With the relative strength EWH is now exhibiting, we expect it to continue outperforming the domestic markets on the upside, and retracing less during the pullbacks along the way. At a minimum, EWH should test resistance of the downtrend line that began with its November 2007 high (the dashed blue line). Since EWH is a low-priced ETF, note that it correspondingly has a low ATR (average true range). This basically means the average distance from its intraday low to intraday high is pretty small. Nevertheless, that problem is easily remedied by increasing your share size on the position. Buying 1000 shares of an ETF that has an ATR of 40 cents (such as EWH) is essentially similar risk as buying 200 shares of an ETF with an ATR of 2 points. If not already long EWH, a pullback to its 20-day EMA (presently at 16.87) would present a low-risk buying opportunity.
Upon doing an updated assessment of industry sectors in the domestic markets, the various biotech ETFs are still showing the most relative strength and bullish chart patterns. Many other industry sectors, such as Financial, Retail, and Software, are now in "no man's land," trapped between key support and resistance levels. Within the biotech arena, both the S&P Biotech SPDR (XBI) and Biotech HOLDR (BBH), which we just sold into strength for a 19-point gain, are trading at fresh 52-week highs. The former is actually at an all-time high. iShares Nasdaq Biotech (IBB), on the other hand, is lagging behind the group and has yet to break out to a 52-week high. This is because IBB excludes biotech stocks listed in the NYSE. If you're already long the biotech ETFs, just keep trailing a loose stop. But if you're not already long XBI or BBH, consider waiting for a pullback to their 10-day moving averages, or at least two-week base of sideways consolidation, before buying either of them.
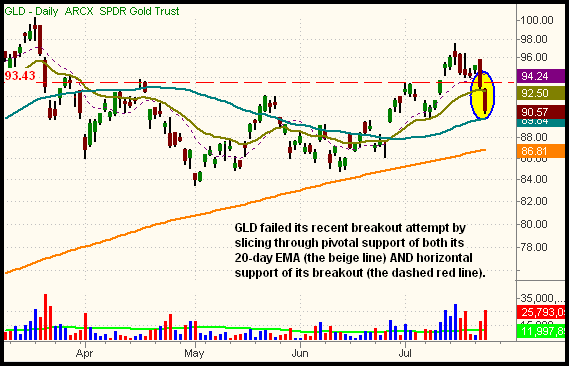
Clearly showing the most downside leadership are the various commodity-based ETFs such as oil, gas, coal, gold, silver, and agriculture. Until recently, the commodities seemed unstoppable in their bullish momentum, but sentiment has rapidly changed. We bought StreetTRACKS Gold Trust (GLD) on July 10, as GLD broke out above a pivotal level of resistance that had been in place for four months. Initially, subsequent price action after the breakout was fine. However, GLD just sliced through what should have been key support of both its 20-day EMA and horizontal price support of its breakout level. This is shown on the daily chart of GLD below:

Yesterday's sudden bearish reversal in GLD triggered our protective stop, but our loss was only one point because we raised the stop to just below new support, after the recent breakout firmed up. When buying any breakout in a volatile market, it's important to raise your initial stop price to just below the breakout level. By doing so, your capital risk is significantly reduced, compared to just keeping the original stop price, if changing market conditions cause the breakout to fail.
It was obviously disappointing that both GLD and RSX failed to follow through in the direction we expected, but that's simply the nature of the business. At any given time, we expect approximately 4 of every 10 of our ETF trades to result in losses. However, our formula to consistent, long-term profitability, and outperforming the major indices of the years, is simply to ensure that the average dollar amount of winning trades is always much greater than the average dollar amount of losing trades. In other words, letting the winners ride, while quickly bailing out on the losers. Consider, for example, that our last four trades consisted of two losses in RSX (because we re-entered once), one loss in GLD, and one gain in BBH. Nevertheless, the end result of these trades was still a net gain of more than 5% of the total value of our model portfolio's account. This is because our gain in BBH was much larger than the cumulative amount of losses from the three losing trades. As long as you're letting your winners ride, but cutting losers quickly, you too will always be a consistently profitable trader. Never forget that professional trading is simply a numbers game!
Open ETF positions:
Long - EWH
Short - (none)
Deron Wagner is the Founder and Head Trader of both Morpheus Capital LP, a U.S. hedge fund, and Morpheus Trading Group, a trader education firm launched in 2001 that provides daily technical analysis of the leading ETFs and stocks. For a free trial to the full version of The Wagner Daily or to learn about Wagner's other services, visit MorpheusTrading.com or send an e-mail to deron@morpheustrading.com.
|