|
The Wagner Daily ETF Report For July 11
A choppy and indecisive session of sideways trading action ended on a positive note yesterday, as the major indices scored a round of moderate gains on higher volume. The Nasdaq Composite climbed 1.0%, while the S&P 500 and Dow Jones Industrial Average scored matching gains of 0.7%. The small-cap Russell 2000 and S&P Midcap 400 indices were higher by 1.0% and 0.5% respectively. Going into the final hour of trading, stocks were in the red and sitting at their intraday lows, but an end-of-day rally enabled the main stock market indexes to finish just off their best levels of the day.
The most positive element of yesterday's action was the higher volume that accompanied the stock market's gains. Total volume in the NYSE rose 6% above the previous day's level, while volume in the Nasdaq increased 3%. The broad-based gains on higher volume enabled both the S&P 500 and Nasdaq to score a bullish "accumulation day" for the second time this week. Over the past three days, overall trading action has been extremely whippy, but the broad market's price to volume pattern has been bullish. On July 8, stocks scored large gains on higher volume, then sold off sharply, but on lighter volume, on July 9. That was followed by another session of higher volume gains on July 10. Higher volume on the "up" days, and lighter volume on the "down" days is what you want to see in a healthy market. Such action is a sign of institutional buying that is necessary to support rising stocks. However, until now, the market has not displayed this pattern of volume for nearly two months. This tells us the stock market's conditions may be improving "under the hood."
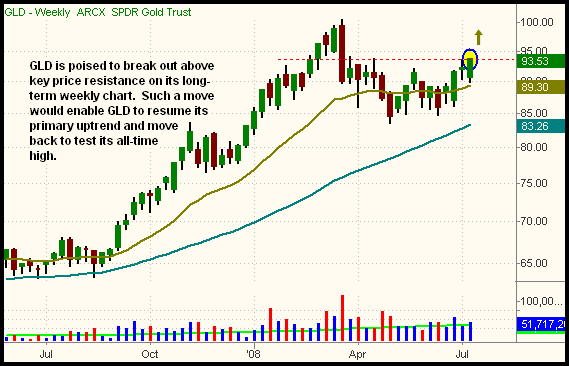
Yesterday, we initiated a new position in StreetTRACKS Gold Trust (GLD), a commodity ETF that mirrors the price of spot gold. Based on its weekly chart formation, it looks as though GLD is ready to resume its long-term uptrend. Take a look:

GLD was formerly in a smooth, long-term uptrend from September, 2007 through March, 2008. After climbing steadily higher for six months, GLD dropped sharply and fell into correction mode, in the latter half of March of this year. Since then, it's been drifting in a sideways range, but GLD is now poised to break out above a key level of horizontal price resistance, right in the vicinity of yesterday's close. Even though it had not yet broken out on the weekly chart, we bought our initial shares of GLD just after yesterday's open, as GLD had bounced perfectly off support of its 20-day EMA and was showing relative strength. If not already long, an entry above yesterday's high is ideal. After GLD clears this area of horizontal price resistance, there should be only minor overhead supply to hold it down. We anticipate a test of its all-time high in the intermediate-term.
Those with smaller trading accounts, or people who simply want more "bang for the buck" might alternatively consider buying DB Gold Double Long (DGP), rather than GLD. DGP, which has only been trading since February of this year, mirrors the price of gold like GLD does, but is designed to move at twice the percentage move of the spot gold commodity. For example, if spot gold futures rally 1%, DGP will rise approximately 2%. Because it's a new offering, it doesn't quite have the popularity of GLD, but still trades an average daily volume of 500,000 shares. Yesterday, by the way, volume in DGP soared to more than three times its average daily level, a sign of institutional buying.
We wrapped up yesterday's commentary by saying the current rally attempt in the S&P 500 was still valid, just as long as the index held above the intraday low of July 7 (1,240). On two occasions yesterday, once in the morning and once in the afternoon, the S&P 500 dipped below that 1,240 support level by falling to 1,237, but the index recovered to close well above 1,240. With the "undercut" of that prior low, the rally attempt in the S&P 500 must be reset. However, the Nasdaq is still technically in rally mode because it held above its prior low. You don't need me to point out that volatility is extremely high right now, but I would like to humbly remind you that reduced share size, along with a strict adherence to protective stops, is a crucial means of capital preservation in the current market environment. Trade what you see, not what you think!
Open ETF positions:
Long - BBH, GLD, UWM
Short - (none)
Deron Wagner is the Founder and Head Trader of both Morpheus Capital LP, a U.S. hedge fund, and Morpheus Trading Group, a trader education firm launched in 2001 that provides daily technical analysis of the leading ETFs and stocks. For a free trial to the full version of The Wagner Daily or to learn about Wagner's other services, visit MorpheusTrading.com or send an e-mail to deron@morpheustrading.com.
|