|
The Wagner Daily ETF Report For July 10
Just when it seemed safe to get back in the water, the sharks quickly proved they haven't yet left the area. In a rare show of amazing whipsaw action, the major indices sharply reversed to give back all of their previous day's gains and then some. Throughout the first half of the day, stocks healthily consolidated near Tuesday's highs, but the bears firmly resumed control just after mid-day. The Dow Jones Industrial Average plunged 2.1%, the S&P 500 2.3%, and the Nasdaq Composite 2.6%. The small-cap Russell 2000 and S&P Midcap 400 indices tumbled 2.8% and 1.4% respectively. Opposite of the preceding day's action, each of the main stock market indexes finished at its lowest level of the day.
The one possible silver lining of yesterday's storm cloud was that the losses occurred on lower turnover. Total volume in the NYSE eased 15%, while volume in the Nasdaq declined 10% below the previous day's level. The lighter trading enabled the S&P 500 and Nasdaq Composite to dodge a bearish "distribution day." Higher volume, on the other hand, would have pointed to institutional selling into strength of Tuesday's rally. Despite yesterday's scary sell-off, the broad market's volume pattern of the past two days has been on the bullish side because stocks rallied on higher volume Tuesday, then declined on lighter volume Wednesday. However, in both the NYSE and Nasdaq, declining volume trounced advancing volume by a margin of approximately 5 to 1. On Tuesday, recall our one concern that the adv/dec volume ratios that accompanied the rally were only positive by about 5 to 2. This tells us yesterday's selling was more widespread among the various industry sectors than Tuesday's buying.
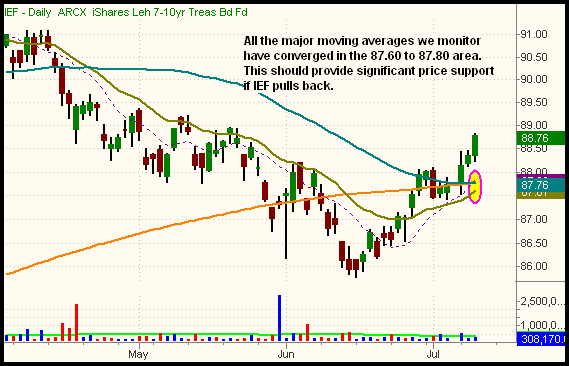
In the July 8 issue of The Wagner Daily, we pointed out the bullishness in the fixed-income (bond) ETFs. Specifically, we illustrated the setup in iShares 7-10 Year Treasury Bond Fund (IEF), which had broken out the previous day. After consolidating in the following session, IEF resumed its strength and moved above the high of its recent range yesterday. This is shown on the daily chart below:

Notice how the 10, 20, 50, and 200-day moving averages of IEF have all converged in the same area, around $87.60 to $87.80. This confluence of moving averages should now act as major support if IEF retraces that far. Now that IEF has confirmed its recent strength, and has significant technical support below, we like the idea of buying it on any modest pullback. Although it's a slow-moving bond ETF, don't forget the major benefit of substantial monthly dividend distributions. Further, the various fixed-income ETFs provide an ideal trading opportunity that has low correlation to the direction of the stock market. That is certainly attractive for those who would rather avoid the high volatility of the equities market right now.
In yesterday's Wagner Daily, we extensively discussed and illustrated the relative strength that Biotech HOLDR (BBH) has been showing over the past month. Looking forward, we then said, "Based on its current pattern of bullish divergence, it's easy to see that BBH will probably surge much higher if the S&P 500 now manages to stage a decent rally in the near-term. If, however, the S&P 500 continues sideways to lower, BBH will probably hold firm, or perhaps still continue slightly higher." So, how did BBH hold up during yesterday's sell-off? It was merely unchanged yesterday (down 5 cents to be exact). Though BBH gave back earlier intraday gains, its ongoing pattern of relative strength to the broad market enabled it to retain all of Tuesday's 3.0% gain. Conversely, the S&P 500 followed up Tuesday's 1.7% gain with a 2.3% loss yesterday. We have no choice but to remain bullish on BBH in the near to intermediate-term, regardless of broad market conditions.
Just as ETFs with relative strength hold firm or continue higher when the broad market sells off, ETFs with relative weakness will also largely ignore the direction of the main stock market indexes. On Tuesday, the Oil Service HOLDR (OIH) dropped 1.2%, as the S&P 500 rallied sharply. Then, OIH fell another 1.7% yesterday. The oil-related, fertilizer/agriculture, and steel ETFs continue to show the most bearish divergence (relative weakness). Ongoing near-term weakness in the energy sector has led our position in UltraShort Oil & Gas (DUG) to a 9.8% gain since our July 7 entry.
We concluded yesterday's commentary by saying, "Overall, it's way too early to tell if yesterday's broad market rally will fizzle out in a few days, or if it was possibly the start of a significant bottom." As ugly as yesterday's session was, that statement is still technically valid because the sell-off did not drive the main stock market indexes below their recent lows. In descending trends, it's not unusual for the stock market to retest its lows after the first rally that tries to form a significant bottom. Such a move is often the final "shakeout" before volatility calms down and stocks finally stabilize. If the major indices would have dropped firmly below their July 7 lows yesterday, the July 8 rally attempt would technically have died, but this was not the case. Going into today's session, keep an eye on the 1,240 level in the S&P 500, as that marks the intraday low of July 7. As long as the index manages to hold above that level, there's still hope stocks will move higher, at least in the near-term.
Open ETF positions:
Long - BBH, DUG
Short - (none)
Deron Wagner is the Founder and Head Trader of both Morpheus Capital LP, a U.S. hedge fund, and Morpheus Trading Group, a trader education firm launched in 2001 that provides daily technical analysis of the leading ETFs and stocks. For a free trial to the full version of The Wagner Daily or to learn about Wagner's other services, visit MorpheusTrading.com or send an e-mail to deron@morpheustrading.com.
|