|
The Wagner Daily ETF Report For July 8
Stocks continued to build on last week's downward momentum in yesterday's session, but a recovery in the final hour of trading lessoned the blow. A bit of resilience in the tech arena helped limit the Nasdaq Composite's loss to just 0.1%, but the broad-based S&P 500 Index fell 0.8%. The Dow Jones Industrial Average declined 0.5%. Small and mid-cap stocks, leaders of the overall stock market just a few weeks ago, continued to play "catch up" to the downside leadership in the S&P and Dow. The Russell 2000 and S&P Midcap 400 indices lost 1.1% and 0.8% respectively. The Nasdaq Composite closed near the middle of the day's range. The rest of the main stock market indexes settled around the bottom third of their intraday trading ranges.
Overall volume surged higher across the board, but this was not surprising considering the previous session's early closing time. Total volume in both the NYSE and Nasdaq increased 67% above last Thursday's levels. Putting turnover levels into simple perspective, volume in both the NYSE and Nasdaq was above 50-day average levels, but lower than the most active days of last week. Market internals were mixed. Declining volume in the NYSE exceeded advancing volume by a margin of just over 2 to 1, but the Nasdaq adv/dec volume ratio was marginally positive.
A rare drop in the price of crude oil helped the energy sector to continue its correction that began last Wednesday. This caused the Oil Service HOLDR (OIH) to close below its 50-day MA for the first time since March 24 of this year. Conversely, the UltraShort Oil and Gas ProShares (DUG), which moves in the opposite direction of the energy sector, rallied to finish above its 50-day MA for the first time in nearly four months. As per the plan discussed in yesterday morning's commentary, this triggered our buy entry into DUG. Our upside price target is a test of the prior high from May 1, just above the $34 area (approximately 19% above our entry price).
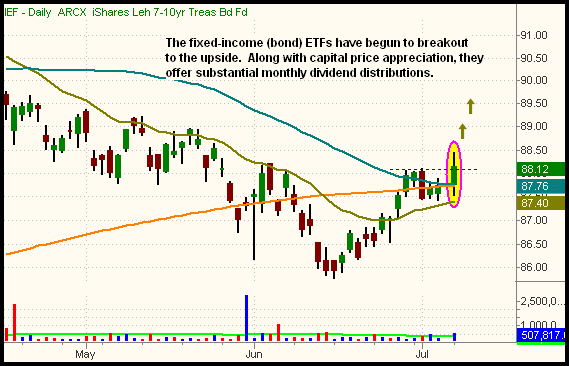
Fixed-income (bond) ETFs are starting to look pretty attractive on a technical level. iShares 7-10 year Treasury Bond Fund (IEF), for example, just broke out above convergence of its 50 and 200-day moving averages, after consolidating for the past week. While this technical breakout should lead the price of IEF higher, another benefit is that most of the fixed-income ETFs also pay substantial monthly dividends. In situations such as this, the combination of price appreciation and monthly dividend distributions makes the bond ETFs look pretty attractive. Below is a daily chart of IEF:

In addition to IEF (the mid-term T-bond ETF), one might also consider both the short-term (SHY) and long-term (TLT) Treasury Bond ETFs. All three have similar chart patterns and pay monthly dividend distributions. The only one of the group we would really avoid is the Corporate Bond Fund (LQD), which has been showing major relative weakness to the gov't bond funds.
The S&P 500 set a new 52-week closing low yesterday, which means there is no significant level of price support in the nearby vicinity. On the weekly chart, the next level of major support is at the 1,220 to 1,225 area. Nevertheless, the index has become pretty far extended away from its 20-day exponential moving average (EMA). In trending markets, both up and down, the 20-day EMA tends to rein in the price of a stock or index whenever it wanders too far away from it. This is similar to the manner in which a leash prevents a dog from straying too far away from its owner. This, of course, does not mean the S&P 500 cannot move lower in the near-term. It does, however, mean that the potential reward for getting heavily short at current levels is much lower than the potential risk of realizing substantial losses from a swift reversal.
If positioned in anything other than cash right now (which is not a bad idea), we like the idea of a portfolio that is hedged on both sides of the market. For minimal risk with maximum profit potential, consider buying only the sector ETFs showing relative strength to the broad market, while simultaneously selling short those with recent relative weakness. On the long side, we like the Biotech HOLDR (BBH), any of the iShares T-Bond ETFs (SHY, IEF, or TLT), StreetTRACKS Gold Trust (GLD), and/or Market Vectors Gold Miners (GDX). On the short side, we like Oil Service HOLDR (OIH), Market Vectors Steel (SLX), and Market Vectors Agribusiness (MOO). Though the main stock market indexes may be "oversold" right now, the three ETFs above are showing newfound relative weakness that should enable them to continue sideways to lower, even if the broad market bounces in the near-term.
Open ETF positions:
Long - BBH, DUG
Short - (none)
Deron Wagner is the Founder and Head Trader of both Morpheus Capital LP, a U.S. hedge fund, and Morpheus Trading Group, a trader education firm launched in 2001 that provides daily technical analysis of the leading ETFs and stocks. For a free trial to the full version of The Wagner Daily or to learn about Wagner's other services, visit MorpheusTrading.com or send an e-mail to deron@morpheustrading.com.
|