| The Wagner Daily ETF Report For July 7 |
| By Deron Wagner |
Published
07/7/2008
|
Stocks
|
Unrated
|
|
|
|
The Wagner Daily ETF Report For July 7
Stocks wrapped up the holiday shortened week with an indecisive session that delivered mixed results last Thursday. The major indices gapped higher on the open, sold off in the first hour, then recovered later in the morning. By the early 1:00 pm ET closing bell, the Dow Jones Industrial Average had advanced 0.7%, but the Nasdaq Composite slipped 0.3%. The benchmark S&P 500 Index eked out a gain of 0.1%. Small and mid-cap issues were the weakest market segments. The Russell 2000 and S&P Midcap 400 indexes fell 0.9% and 1.1% respectively. Both the S&P 500 and Nasdaq Composite settled in the middle of their intraday trading ranges, showing indifference to end the week.
With the stock market closing three hours early last Thursday, turnover was obviously dramatically lower than the previous day. Total volume in the NYSE decreased 38%, while volume in the Nasdaq receded 41%. However, if not for the early closing time, volume probably would have come in significantly higher. At 1:00 pm ET, turnover was tracking well above the previous day's level at the same time of day. This was interesting, as it's unusual to see higher turnover ahead of a three-day holiday weekend. Despite the higher closing prices in the S&P 500 and Dow Jones Industrial Average, declining volume in the NYSE still exceeded advancing volume by a margin of 3 to 2. The Nasdaq adv/dec volume ratio was negative by 2 to 1.
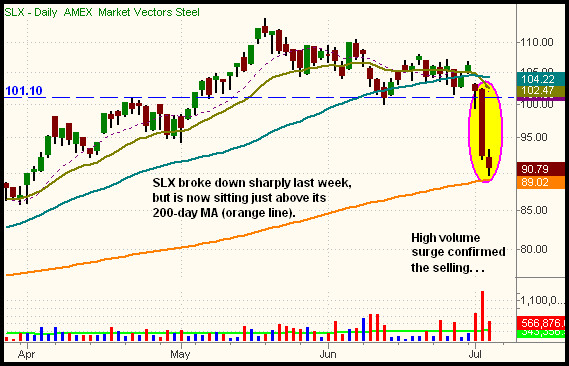
Throughout last week's session, we began to notice instances of institutional sector rotation. Industry sectors that have been ignoring the stock market's weakness for months suddenly began to sell-off sharply. Steel, Agriculture/Fertilizers, Coal, and Oil sectors all corrected sharply last week. Market Vectors Steel (SLX) broke down to net us a gain on the short side of nearly 11 points (11.2%) last week. Volume surged to four times its average daily level when it fell apart on July 2, indicating that institutions were running for the exit doors. Going into the new week, SLX may present an ideal re-entry point to sell short if it manages to put in a decent bounce. Specifically, a rally up to its 20-EMA on the 60-minute chart (presently at $96.47) would be a low-risk entry point to sell short. Note the high volume that coincided with the breakdown of SLX on the daily chart below:
Market Vectors Agribusiness (MOO), which we pointed out as a potential short sale in the July 1 issue of The Wagner Daily, has fallen 4.7 points (7.5%) since then. Over just the past two days, oil-related ETFs such as the Oil Service HOLDR (OIH) have failed their recent breakout attempts and fallen sharply. As we enter the new week, we anticipate further downside in the energy sector. To profit from such weakness, consider buying the inversely correlated UltraShort Oil and Gas ProShares (DUG). On the daily chart below, notice how DUG rallied to probe above its 50-day MA on an intraday basis last Thursday:
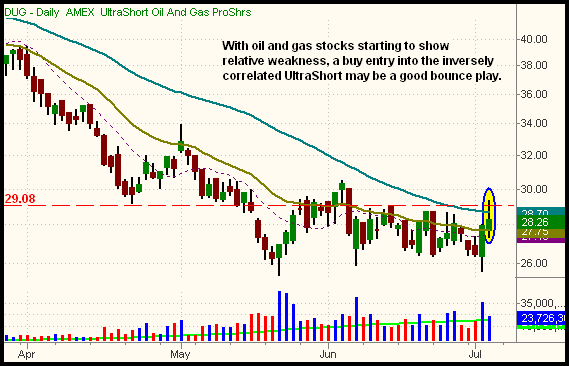
With DUG now testing overhead resistance of its 50-day MA, the ETF may soon reverse to bullish short and intermediate-term trends. We like DUG for potential long entry over last Thursday's high of $29.34. Waiting for a rally above that day's high before buying is a good way to reduce your risk of buying a failed bullish trend reversal. Obviously, one alternatively might consider selling short OIH or S&P Select Energy (XLE) instead of buying DUG, but buying the inversely correlated ETFs eliminates the occasional problem of locating shares available for short selling. It also enables investors to easily take bearish positions in non-marginable, cash accounts such as IRAs or 401ks.
If institutional money is rotating out of leading sectors, it must be rotating into somewhere else. We have recently noticed the most relative strength and bullish chart patterns in the biotech and gold/silver sectors. We discussed the new-found relative strength in the Biotech HOLDR (BBH) several times last week, as well as the bullish momentum and upside trend reversals shaping up in StreetTRACKS Gold Trust (GLD), iShares Silver Trust (SLV), and Market Vectors Gold Miners (GDX). Because we expect further gains in both biotech and gold/silver sectors this week, we continue to hold our long position in the Biotech HOLDR (BBH). Our initial entry into BBH was on July 2, but we added to the position when it moved higher on July 3. Presently, BBH is our only open ETF position, but we're quite happy about that. Being mostly in cash feels great because the current market is not presenting us with an abundance of trade ideas that carry a low risk/reward. We're not about to "force" trades when we can simply wait for the next ideal setup to pass in our direction.
Open ETF positions:
Long - BBH
Short - (none)
Deron Wagner is the Founder and Head Trader of both Morpheus Capital LP, a U.S. hedge fund, and Morpheus Trading Group, a trader education firm launched in 2001 that provides daily technical analysis of the leading ETFs and stocks. For a free trial to the full version of The Wagner Daily or to learn about Wagner's other services, visit MorpheusTrading.com or send an e-mail to deron@morpheustrading.com.
|


 Free Festival of Traders Videos