| The Wagner Daily ETF Report For June 25 |
| By Deron Wagner |
Published
06/25/2008
|
Stocks
|
Unrated
|
|
|
|
The Wagner Daily ETF Report For June 25
Stocks followed through on recent weakness out of the starting gate yesterday morning, but reversed higher at mid-day. Selling in the final ninety minutes subsequently caused the major indices to give up their gains and close in the red. The Nasdaq Composite, a former leader of the broad market, continued showing relative weakness by falling for a third straight day and losing 0.7%. Both the S&P 500 and Dow Jones Industrial Average declined 0.3%. The small-cap Russell 2000 and S&P Midcap 400 indices shed 1.7% and 1.3% respectively. The main stock market indexes closed just below the middle of their intraday ranges.
Turnover rose across the board, causing both the S&P 500 and Nasdaq Composite to register another bearish "distribution day." Selling by mutual funds, hedge funds, and other institutions caused total volume in the NYSE to rise 25% above the previous day's level, while volume in the Nasdaq ticked 15% higher. Trading is often light ahead of Federal Open Market Committee (FOMC) meetings, but that was not the case yesterday. Volume in both exchanges exceeded 50-day average levels. Declining volume in the NYSE only marginally exceeded advancing volume. The Nasdaq adv/dec volume ratio was negative by 2 to 1.
In yesterday's commentary, we pointed out the breakout to a new all-time high in the Oil Service HOLDR (OIH). However, we also cautioned that recent indecision in the oil-related ETF made it tricky to hold them overnight. A two percent pullback in OIH yesterday proved the merit of our hesitation. OIH closed well below its breakout level of $221 and retraced half of the previous day's gain, putting the ETF in jeopardy of failing the breakout attempt. If you bought the morning pullback in OIH and are still long, you might consider having a tight stop going into today's session, as failed breakouts frequently reverse to the downside rather swiftly. Unfortunately, day-to-day indecision has been plaguing the broad market in recent weeks, making it challenging to both buy breakouts above resistance and sell short breakdowns below support, regardless of industry sector.
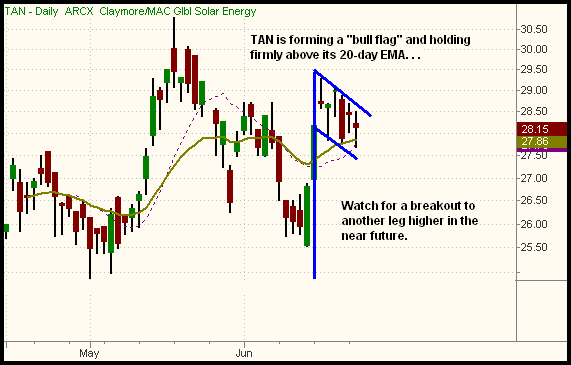
Per Intraday Trade Alert to subscribers of The Wagner Daily, we bought Claymore Global Solar Energy (TAN) yesterday afternoon. Since surging more than 9% off its lows in mid-June, TAN has been forming a "bull flag" pattern on its daily chart, holding above support of its 20-day EMA. Because of its relative strength, TAN should be one of the first ETFs to surge higher when the major indices begin to bounce. We bought TAN because the first signs of such a broad market bounce presented themselves yesterday afternoon. Leading stocks in the solar energy sector, such as First Solar (FSLR) and Canadian Solar (CSIQ), are also exhibiting bullish chart patterns and are poised to make another leg higher. The "bull flag" pattern of TAN is shown on the daily chart below. By the way, the ticker symbol for this ETF is pretty cool (or perhaps we should say hot):

Aside from TAN, there is just one other pure-play ETF in the solar energy field -- Market Vectors Solar (KWT). Both have similar chart patterns, but we prefer TAN due to its higher average daily volume. Although ETFs are synthetic instruments where a low average daily volume is largely irrelevant, ETFs that trade an average of at least 100,000 shares per day will usually have tighter spreads between the bid and ask prices.
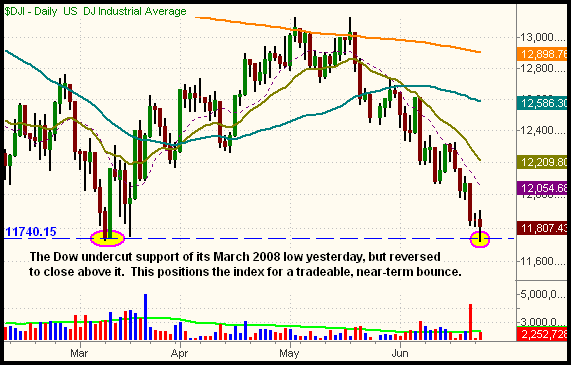
Yesterday, the Dow Jones Industrial Average probed below key support of its March 2008 low on an intraday basis, but reversed to close just above it. Now that the index has completed the entire reversal back to its March low that we have been anticipating for weeks, this major area of support could give traders a good excuse to start buying stocks again, at least in the near-term. The following daily chart of the Dow illustrates the potential for at least a short-term "double bottom" to be formed:

Even though the Dow could easily put in a significant bounce off its March low, remember that the blue-chip index has shown the most relative weakness on the way down. Of the main stock market indexes, only the Dow has moved fully back down to its March 2008 low. Because we like the possibility of a broad market bounce from current levels, we bought the Ultra Russell 2000 ProShares (UWM) yesterday. Since small and mid-cap stocks showed the most relative strength throughout the stock market's intermediate-term downtrend, we felt it was a better bet to buy the Russell 2000 than the Dow.
Going into today, traders will be focused on the Fed's decision on interest rates and its accompanying statement on economic policy. Trading is typically light and range-bound in the first half of Fed days, but higher volume in the preceding day means we could see some volatility this morning as well. Although pre-market futures action is indicating an open near yesterday's highs, be prepared for whippy and erratic price action after the 2:15 pm EDT Fed announcement.
Open ETF positions:
Long - TAN, UWM
Short - SLX
Deron Wagner is the Founder and Head Trader of both Morpheus Capital LP, a U.S. hedge fund, and Morpheus Trading Group, a trader education firm launched in 2001 that provides daily technical analysis of the leading ETFs and stocks. For a free trial to the full version of The Wagner Daily or to learn about Wagner's other services, visit MorpheusTrading.com or send an e-mail to deron@morpheustrading.com.
|